NOTES
ABOUT THIS PUBLICATION
This publication presents information about the labour force characteristics of Aboriginal and Torres Strait Islander Australians. Information on labour force characteristics is presented by sex, age, state or territory, and remoteness.
The statistics in this publication were compiled from the monthly Labour Force Survey, conducted throughout Australia by the Australian Bureau of Statistics (ABS). Monthly data have been pooled to produce annual estimates.
Due to a change in methodology, estimates from the 1994-2000 release under this catalogue number - Occasional Paper: Labour Force Characteristics of Aboriginal and Torres Strait Islander Australians, Experimental Estimates from the Labour force Survey (cat. no. 6287.0), are not strictly comparable with the estimates for 2002-2005 in this publication.
ROUNDING
As estimates have been rounded, discrepancies may occur between sums of the component items and totals.
INQUIRIES
For further information about these and related statistics, contact the National Information and Referral Service on 1300 135 070 or Craig Blair on Canberra (02) 6252 5967.
SUMMARY OF FINDINGS
PARTICIPATION
In 2005, an estimated 176,400 Indigenous people were in the labour force (i.e. either employed or unemployed). This represented a labour force participation rate for all Indigenous people aged 15 years and over of 57%. Of the Indigenous people in the labour force, more lived in Regional areas (75,100 people) than in Major Cities (59,300) or Remote areas (42,000).
Major Cities had the highest participation rate at 63% in 2005, and also experienced the greatest increase since 2004 (up 4.4 percentage points). The participation rate also increased in Regional areas between 2004 and 2005 (from 54% to 58%) while Remote areas remained relatively stable.
Males accounted for 56% of the Indigenous labour force in 2005. The labour force participation rate for Indigenous males (66%) was considerably higher than for Indigenous females (49%). The participation rate of Indigenous females in Remote areas steadily declined between 2002 and 2005, falling from 56% to 39%.
The participation rate for people aged 15 to 64 years was only slightly higher than the rate for all Indigenous people aged 15 years and over, at 59%. Indigenous people aged 65 years and over accounted for 4.4% of the total Indigenous population aged 15 years and over in 2005. In comparison, the non-Indigenous population aged 65 years and over accounted for 16% of the total non-Indigenous population aged 15 years and over in 2005.
Between 2002 and 2005, the Indigenous population not in the labour force increased from 117,600 to 133,200, but peaked at 137,700 in 2004. In 2005, more Indigenous people not in the labour force lived in Regional areas (54,600) than in Remote areas (43,400) and Major Cities (35,200). Females accounted for 61% of the total Indigenous population not in the labour force.
EMPLOYMENT
In 2005, there were an estimated 147,400 Indigenous people aged 15 years and over in employment. This represented 48% of the Indigenous population aged 15 years and over. The employment to population ratio for Indigenous Australians increased by 2.4 percentage points in 2005, following a decline of 3 percentage points between 2002 and 2004. The employment to population ratio for Indigenous males (55%) has returned to levels similar to 2002 (55%) and 2003 (54%). The employment to population ratio for Indigenous females has remained relatively stable between 2002 (42%) and 2005 (41%).
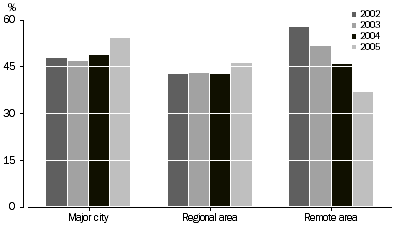
In 2005, there were 51,000 Indigenous people employed in Major Cities, 59,500 employed in Regional areas and 36,900 employed in Remote areas. The employment to population ratio was 54% in Major Cities, 46% in Regional areas and 43% in Remote areas. Indigenous females in Remote areas experienced a considerable decrease in the employment to population ratio, falling from 52% in 2002 to 36% in 2005. Indigenous males in Remote areas also experienced a decline, from 63% in 2002 to 51% in 2005. Indigenous people participating in the CDEP scheme, who are classified by the ABS as employed, are likely to form a significant proportion of Indigenous employment in remote areas (see National Aboriginal and Torres Strait Islander Social Survey (cat. no. 4714.0)).
Employment to population ratio of Indigenous persons
UNEMPLOYMENT
In 2005, the unemployment rate for the Indigenous population was 16%. The unemployment rate for Indigenous people was 14% in Major cities, 21% in Regional areas, and 12% in Remote areas. However, estimates of unemployment for Remote areas should be used with great care because they are subject to high sampling errors. In addition, Remote areas are regions which generally have limited employment opportunities and this is reflected in the low number of Indigenous people actively looking for work.
 Print Page
 Print All