Reissue Note - 27 September 2007: The data items of Sales and service income and Industry value added were inadvertently interchanged for the year of 2002-03 in the Employment Size folder.
NOTES
ABOUT THIS PUBLICATION
This publication presents estimates, from the annual Economic Activity Survey, of the economic and financial performance of the Australian manufacturing industry for 2004-05 together with data on a comparable basis from 2001-02 and intervening years.
CHANGES TO THIS PUBLICATION
This issue introduces a selection of profitability measures and industry performance ratios, comparable with those included in other ABS industry statistics publications. It also presents a table illustrating the export performance of Australian manufacturing, using Economic Activity Survey data, over the period from 2001-02 to 2004-05.
Employment data in this issue are based on a new methodology for estimating the employment of businesses that contribute to the estimates via business income taxation data. See Technical Note 1 for further information.
REVISIONS
Estimates for earlier years have been revised since the previous issue of this publication. The revisions are incorporated in this publication and in the extended data spreadsheets available free on-line.
The effect of these revisions on the 2003-04 national estimates of key financial variables for the manufacturing industry has been an increase of 0.1% (or $159m) in sales and service income, a decrease of 0.2% ($82m) in wages and salaries paid, and an increase of 0.5% ($424m) in industry value added. Effects may be greater at lower levels of the industry classification and/or for other variables.
The application of the new model for estimating employment noted above has resulted in revisions to the estimates of employment for earlier years.
INFORMATION AVAILABLE ON-LINE
The text components of this publication are available free on-line. A PDF publication and extended data spreadsheets are also available free on-line.
Other information is also available via the Manufacturing Statistics theme page. To access the theme page, go to the ABS website home page <https://abs.gov.au>. Access the Themes page by either opening the Themes hotlink from the top menu bar or opening the Industry hotlink shown under Themes, in the left-side navigator. Then open the Manufacturing hotlink shown under Industry.
INQUIRIES
For further information about these and related statistics, contact the National Information and Referral Service on 1300 135 070 or John Ridley on Sydney (02) 9268 4541.
CHAPTER 1 SUMMARY
INTRODUCTION
This publication presents estimates, from the annual Economic Activity Survey, of the economic and financial performance of the Australian manufacturing industry.
This industry is specified in Division C of the Australian and New Zealand Standard Industrial Classification (ANZSIC), 1993 edition. Please see paragraph 2 of the Explanatory Notes for a full definition.
KEY DATA
Table 1.1 presents a time series for selected items, from 2001-02 to 2004-05. All value data in this table are shown at current prices.
By all four major aggregates presented, the Australian manufacturing industry showed growth in 2004-05 when compared to 2003-04. Sales and service income increased by 7%, industry value added by 8%, wages and salaries by 5% and employment increased by 2%. Commentary about these items is presented in Chapter 2.
For information about survey methodology, see Technical Note 1.
The Glossary provides definitions for terms used.
CHAPTER 2 NATIONAL DATA
INTRODUCTION
Statistics in this publication relate to the manufacturing industry as defined by the Australian and New Zealand Standard Industrial Classification (ANZSIC), 1993 edition. The commentary focuses mainly on the major data variables for the nine ANZSIC industry subdivisions that comprise the manufacturing industry.
OVERVIEW
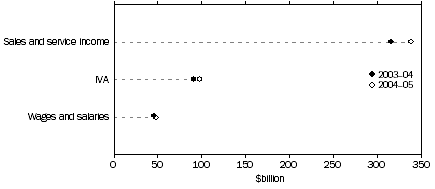
Most major indicators of activity for the Australian manufacturing industry increased, in current price terms, during 2004-05. Sales and service income increased 7% and industry value added (IVA) rose by 8%. Manufacturers paid $48.4b in wages and salaries in 2004-05, 5% more than in 2003-04; employment increased by 2%. The increase in net capital expenditure was 23% (from $11.4b to $14.0b). Export sales of goods produced increased by 2% (from $48.3b in 2003-04 to $49.2b in 2004-05).
SELECTED VARIABLES, 2003-04 AND 2004-05
SALES AND SERVICE INCOME
Sales and service income of manufacturing industry in Australia in 2004-05, at $338.4b, was $22.7b (or 7%) higher than in 2003-04.
Over the period from 2001-02 to 2004-05, manufacturing's total sales and service income increased by 16%.
At the industry group level, of those groups available for publication, Prefabricated building manufacturing (ANZSIC group 291) recorded the largest percentage increase in sales and service income (25%) between 2003-04 and 2004-05. The largest absolute increase, of $4.2b, was recorded by Petroleum refining (ANZSIC group 251). The industry group which made the largest contribution to sales and service income in 2004-05 was Motor vehicle and part manufacturing (ANZSIC group 281), at 7%.
Sales and service income per person employed in Australian manufacturing in 2004-05 was $320,000, 5% (or $15,300) higher than for 2003-04, and 14%, (or $39,900) higher than in 2001-02.
INDUSTRY VALUE ADDED
DISTRIBUTION OF IVA ACROSS INDUSTRIES, 2003-04 and 2004-05
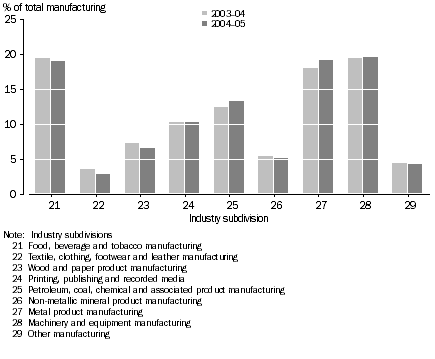
IVA for the manufacturing industry increased by $6.9b (8%) to $97.8b in 2004-05. This increase is the product of the $22.7b increase in sales and service income mentioned above, and increases of $13.3b (8%) in purchases of goods and materials, $5.0b (9%) in other intermediate input expenses, and $2.5b in the value of the change in inventories (compared to a decrease last year).
Seven of the nine manufacturing industry subdivisions recorded increases in IVA in current price terms between 2003-04 and 2004-05, although the increases were less than 2% in two of them.
At the industry group level, of those groups available for publication, Petroleum refining (ANZSIC group 251) recorded the largest increase in IVA in both absolute and percentage terms ($0.9b, or 75%) in 2004-05. Basic non-ferrous metal manufacturing (ANZSIC group 272) experienced the second largest absolute growth in IVA, $0.6b (13%), and the second highest percentage increase in IVA (26%, or $75m) belonged to Prefabricated building manufacturing (ANZSIC group 291).
As measured by contribution to IVA, the largest manufacturing industry groups in 2004-05 (of those available for publication) each accounted for 6% of the estimate for total manufacturing: Motor vehicle and part manufacturing (ANZSIC group 281), with $6.1b, Publishing (ANZSIC group 242), with $5.7b, and Basic non-ferrous metal manufacturing (ANZSIC group 272), with $5.4b.
IVA per person employed in manufacturing has increased by 5%, from $87,700 in 2003-04 to $92,400 in 2004-05.
EMPLOYMENT
Australian manufacturing industry employed 1,057,600 persons at the end of June 2005, an increase of 21,100 (or 2.0%) compared to the end of June 2004.
Employment rose in seven of the nine manufacturing industry subdivisions between June 2004 and June 2005. The industry subdivisions which experienced the greatest percentage increases in employment were Metal product manufacturing (up 7.2%, from 162,300 to 174,000), Printing, publishing and recorded media (up 6.3%, from 102,200 to 108,600) and Non-metallic mineral product manufacturing (up 4.9%, from 44,300 to 46,400). Employment was reduced in Textile, clothing, footwear and leather manufacturing (down 7.9%, from 56,500 to 52,000) and Petroleum, coal, chemical and associated product manufacturing (down 0.9%, from 105,100 to 104,200).
At the industry class level, the five largest manufacturing industries as measured by employment at the end of June 2005 were Printing (ANZSIC Class 2412) (47,700 persons), Fabricated metal product manufacturing n.e.c. (ANZSIC 2769) (33,800 persons), Wooden furniture and upholstered seat manufacturing (ANZSIC 2921) (33,000 persons), Meat processing (ANZSIC 2111) (29,400 persons) and Motor vehicle manufacturing (ANZSIC 2811) (28,200 persons).
At the end of June 2005, employment in Australian manufacturing was 1.4% (or 14,500 persons) greater than at the end of June 2002.
EMPLOYMENT SIZE
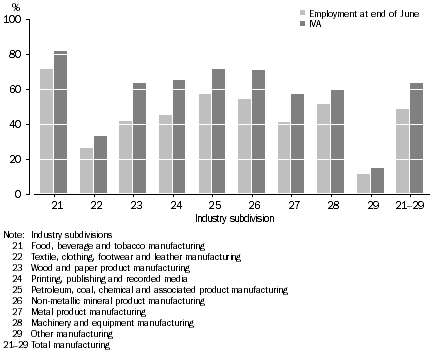
In 2004-05, businesses employing 100 or more persons accounted for 49% of total manufacturing employment in Australia and 61% of wages and salaries. Their contribution to sales and service income was 66%, and to industry value added 64%. These proportions are very similar to those of 2003-04.
CONTRIBUTION TO MANUFACTURING INDUSTRIES BY BUSINESSES EMPLOYING 100 OR MORE PERSONS, 2004-05
LABOUR COSTS
The Australian manufacturing industry paid $48.4b in wages and salaries in 2004-05, 5% higher than in 2003-04.
Total wages and salaries paid rose, in current price terms, in eight of the nine manufacturing industry subdivisions between 2003-04 and 2004-05. Recording a decline of 7%, Textile, clothing, footwear and leather manufacturing was the exception.
The manufacturing industry subdivision showing the largest percentage increase in wages and salaries in 2004-05 was Printing, publishing and recorded media (up 9%, or $0.4b, to $5.2b). In absolute terms, Metal product manufacturing and Machinery and equipment manufacturing recorded the largest increases (each up $0.6b, or 7% and 6% respectively).
The industry group, of those available for publication, which paid the most in wages and salaries was Motor vehicle and part manufacturing (ANZSIC group 281), with $3.5b or 7% of total manufacturing. Industrial machinery and equipment manufacturing (ANZSIC group 286), which paid $2.7b (or 6%), ranked second.
WAGES AND SALARIES PER PERSON EMPLOYED AT END OF JUNE, 2003-04 and 2004-05
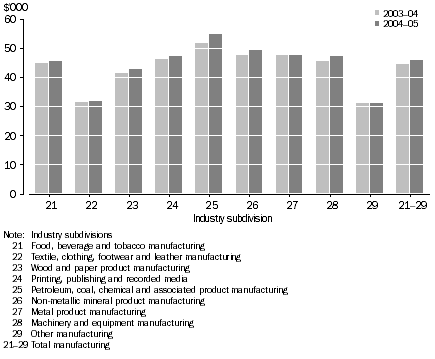
Wages and salaries represented 85% of the $57.2b in total labour costs paid by Australian manufacturing in 2004-05, and 89% of the value of selected labour costs (i.e., with fringe benefits tax and payroll tax excluded). The proportions are slightly higher in Printing, publishing and recorded media (86% and 91% respectively). The largest employer in the manufacturing industry, Machinery and equipment manufacturing, incurred the highest workers' compensation premiums/costs during the year, just ahead of Food, beverage and tobacco manufacturing (even though it employs 20% fewer people than Machinery and equipment manufacturing).
PROFITABILITY AND EARNINGS
Total trading profit for the manufacturing industry in 2004-05 was $93.2b, an increase of $6.6b (8%) over the previous year. Of the seven industry subdivisions in which trading profit increased, the largest increase in absolute terms ($2.3b, or 7%) occurred in Metal product manufacturing. The largest percentage increase in trading profit was recorded by Petroleum, coal, chemical and associated product manufacturing (16%, or $1.7b).
Although Earnings Before Interest and Tax (EBIT) rose more strongly, by 16%, or $4.7b, this result reflects a more mixed performance within the industry. EBIT increased in five of the nine manufacturing subdivisions. Movements in EBIT compared to the estimates for 2003-04 ranged from an increase of 52% ($2.7b) in Metal product manufacturing to a decrease of 11% ($0.2b) in Wood and paper product manufacturing. The other industries in which EBIT declined in 2004-05 were Textile, clothing, footwear and leather manufacturing (down 8%, or $74m), Food, beverage and tobacco manufacturing (down 5%, or $0.4b) and Non-metallic mineral product manufacturing (down marginally).
Four industry subdivisions recorded increases in operating profit before tax (OPBT), and total manufacturing improved its OPBT by 17% (or $4.2b). Movements in OPBT compared to the estimates for 2003-04 ranged from an increase of 59% ($2.8b) in Metal product manufacturing to a decrease of 18% ($137m) in Textile, clothing, footwear and leather manufacturing.
CAPITAL EXPENDITURE
Net capital expenditure by manufacturing businesses rose by 23%, or $2.6b, to $14.0b between 2003-04 and 2004-05. Total acquisitions grew by 17% ($2.3b), including increases of 12% ($1.3b) in outlays on plant, machinery and equipment and 42% ($0.6b) in expenditure on dwellings, other buildings and structures. Asset disposals in 2004-05 were 14% ($0.3b) lower than in the previous year.
INDUSTRY PERFORMANCE MEASURES
A range of performance measures, mainly expressed as ratios, can be produced from the data available from businesses' financial statements. A selection of these are presented in table 2.7 for each manufacturing industry subdivision. Definitions are provided in the Glossary. Information about the uses and limitations of these measures can be found in Explanatory Notes paragraphs 22-27.
The following summarises the manufacturing industry's performance ratios for 2004-05, as set out in detail in table 2.7:
- The profit margin for total manufacturing in 2004-05 is estimated at 8.5%, an increase from 7.7% in 2003-04. At the industry subdivision level, profit margins ranged from 15.2% for the Printing, publishing and recorded media industry to 6.2% for Petroleum, coal, chemical and associated product manufacturing. Estimated profit margin declined in five subdivisions: Food, beverage and tobacco manufacturing, Textile, clothing, footwear and leather manufacturing, Wood and paper product manufacturing, Non-metallic mineral product manufacturing, and Other manufacturing. The largest increase (from 7.9% in 2003-04 to 11.4% in 2004-05) occurred in Metal product manufacturing.
- Interest coverage for total manufacturing improved in 2004-05 to 7.3 times, up from 6.9 times in 2003-04. This improvement belies the fact that interest coverage decreased in six of the nine manufacturing subdivisions. The industries which improved their interest coverage were Metal product manufacturing (from 9.6 times to 16.0 times), Machinery and equipment manufacturing (7.3 times to 8.1 times), and Petroleum, coal, chemical and associated product manufacturing (4.4 times to 5.5 times).
- In one manufacturing industry subdivision, Petroleum, coal, chemical and associated product manufacturing, IVA was double the estimate of its selected labour costs. For manufacturing overall, the ratio was 1.8 times (up from 1.75 times in 2003-04). Textile, clothing, footwear and leather manufacturing shows the lowest value (1.5 times) for this ratio, just behind Machinery and equipment manufacturing (at 1.51 times).
- Selected labour costs per person employed ranged from $61,500 in Petroleum, coal, chemical and associated product manufacturing to $35,700 in Other manufacturing. For total manufacturing, the estimate rose by 3% (from $50,200 to $51,500) in 2004-05.
- The manufacturing industry's investment rate (value added) in 2004-05 was 16.4%, compared to 15.1% in 2003-04. This reflected, in 2004-05, a range from 10.0% for Other manufacturing to 23.4% for Petroleum, coal, chemical and associated product manufacturing.
INDUSTRY SUBDIVISION ANALYSIS
Food, beverage and tobacco manufacturing
By most measures presented, this industry constitutes about one-fifth of Australian manufacturing. In 2004-05, Food, beverage and tobacco manufacturing was the largest manufacturing industry as measured by its share of sales and service income (21%) and purchases of goods and materials (22%). It ranked second in wages and salaries (18%), employment (18%), asset acquisitions (21%), net capital expenditure (22%), trading profit (19%), OPBT (19%) and EBIT (20%), and third in its contribution to IVA (19%).
The industry is dominated by businesses employing 100 or more persons. These businesses contribute 82% of the subdivision's IVA, 80% of wages and salaries, 78% of sales and service income and 71% of employment. Compared to businesses employing 100 or more persons across the other eight industry subdivisions, those in Food, beverage and tobacco manufacturing provided the greatest proportion of employment (26%), sales and service income (25%), and IVA and wages and salaries (both 24%). One half of this industry's IVA is produced by businesses employing 1,000 or more persons.
Textile, clothing, footwear and leather manufacturing
The smallest manufacturing subdivision by most key measures presented, Textile, clothing, footwear and leather manufacturing accounted for 3% or less of total manufacturing IVA, sales and service income, purchases of goods and materials, wages and salaries and all three profit measures. The industry made the smallest contribution to the total profits of Australian manufacturing and was its second smallest employer in 2004-05, providing 5% of the total employment in Australian manufacturing.
Over the period from 2001-02 to 2004-05, employment in this industry has decreased by 20%. Within Textile, clothing, footwear and leather manufacturing, businesses employing 0-4 persons accounted for 24% of the subdivision's estimated total employment. However, of the employment size categories presented, businesses employing from 20 to 49 persons (with 17% of the industry's employment) made the greatest contribution to the subdivision's sales and service income (17%), and IVA (18%) and wages and salaries (19%).
Wood and paper product manufacturing
In 2004-05, Wood and paper product manufacturing accounted for 7% of total IVA, employment and trading profit for manufacturing, 6% of wages and salaries and EBIT, and 5% of sales and service income, purchases of goods and materials, and OPBT.
Most key variables showed little change during the year. Sales and service income and total income declined marginally, and IVA and total expenses were unchanged. Both EBIT and OPBT declined by 11%, whereas trading profit was stable.
Printing, publishing and recorded media
During 2004-05 this industry recorded a 9% increase in IVA, matching its increase in sales and service income. Wages and salaries increased by 9%, trading profit by 9%, EBIT by 26% and OPBT by 22%.
Printing, publishing and recorded media's share of manufacturing purchases of goods and materials in 2004-05 was, at 4%, substantially less than its contribution to manufacturing's total IVA (10%), employment (10%), wages and salaries (11%), sales and service income (7%), and EBIT and OPBT (both 12%). Conversely, labour costs constituted 30% of the total expenses of this industry, compared to 18% at the total manufacturing level.
Petroleum, coal, chemical and associated product manufacturing
Petroleum, coal, chemical and associated product manufacturing IVA and sales and service income increased by 15% in 2004-05. Although trading profit increased by 16%, OPBT and EBIT increased much more substantially (47% and 39% respectively).
In 2004-05 the industry accounted for 13% of IVA for manufacturing, 18% of sales and service income, 22% of purchases of goods and materials, 12% of wages and salaries, 13% of trading profit and OBPT, 14% of EBIT, and 10% of employment at the end of June 2005.
Net capital expenditure in 2004-05 was $2.8b, an $0.8b (41%) increase over the previous year.
Businesses employing 100 or more people accounted for 57% of employment in Petroleum, coal, chemical and associated product manufacturing. Such businesses produced 80% of the industry's sales and service income and 71% of its IVA, and paid 69% of its wages and salaries.
Non-metallic mineral product manufacturing
This industry increased its wages and salaries paid by 9% in 2004-05. Despite increases of 5% in sales and service income and 6% in total income, total expenses rose by a greater amount (7%, or $0.9b). Hence EBIT eased marginally, and OPBT fell by 6%. IVA increased only marginally.
In 2004-05, the subdivision's share of both total acquisition of assets and net capital expenditure in manufacturing was 6%.
Metal product manufacturing
This industry comprises about one-fifth of Australian manufacturing. Its share of employment is slightly less (16%). In 2004-05 Metal product manufacturing was the largest source of manufacturing OPBT (26%), trading profit (19%), EBIT (24%), acquisitions of assets and (22%), and net capital expenditure (23%). It ranked second in terms of IVA, sales and service income and total income (all 19%), and third in employment (16%).
In 2004-05, Metal product manufacturing's IVA increased by 19%, sales and service income by 11%. Profitability also improved markedly, OPBT rising by 59%, EBIT by 52% and trading profit by 15%. Wages and salaries and employment both increased by 7%.
Metal product manufacturing increased its net capital expenditure by $1.2b (or 60%) in 2004-05, the strongest absolute and percentage growth of any manufacturing subdivision.
Businesses employing fewer than 100 persons provided 59% of this industry's employment at the end of June 2005.
Machinery and equipment manufacturing
In 2004-05, IVA of Machinery and equipment manufacturing increased by 8%. Wages and salaries grew by 6%. The industry's increases in OPBT (14%) and EBIT (13%) exceeded its increase in trading profit (7%) during the year.
Machinery and equipment manufacturing was the largest source of manufacturing IVA ($19.b, or 20%) and employment (237,200 persons, or 22%), and paid the greatest amount ($11.2b, or 23%) in wages and salaries. The subdivision contributed 17% to total capital acquisitions and 15% to net capital expenditure. It contributed 19% to the trading profit, but only 14% to EBIT and OPBT, of total manufacturing.
The largest recipient of funding from government for operational costs of any manufacturing industry, Machinery and equipment manufacturing received 69% of all such funding provided to manufacturing in 2004-05. Assistance to the motor vehicle industry is a major element.
Employment within Machinery and equipment manufacturing was almost equally shared between businesses employing fewer than 100 persons (51%) and those employing 100 or more (49%). However, businesses employing 100 or more persons paid 60% of the wages and salaries of this industry, and made similar contributions to sales and service income (63%) and IVA (60%).
Other manufacturing
In 2004-05, Other manufacturing accounted for 7% of total manufacturing employment but 5% or less of wages and salaries, IVA, sales and service income, purchases of goods and materials, and the various profit measures presented.
Other manufacturing is the subdivision most heavily dominated by businesses employing fewer than 100 persons. In this industry, these businesses account for 89% of employment, 85% of wages and salaries, 86% of sales and service income, and 85% of IVA. In all the employment size categories representing businesses employing fewer than 50 persons, Other manufacturing made the greatest percentage contribution of any manufacturing industry.
CHAPTER 3 STATES, TERRITORIES AND AUSTRALIA
INTRODUCTION
This chapter presents estimates of key variables at the state and territory level. For information about how these estimates are derived, please see paragraphs 28 and 29 of the Explanatory Notes. The commentary outlines features of the distribution of these key variables across and within states and territories.
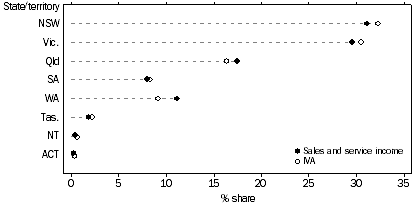
The above graphic illustrates each state or territory's share of economic aggregates relating to Australian manufacturing in 2004-05. The distribution is very similar across all four variables presented.
DISTRIBUTION OF EMPLOYMENT AND WAGES AND SALARIES
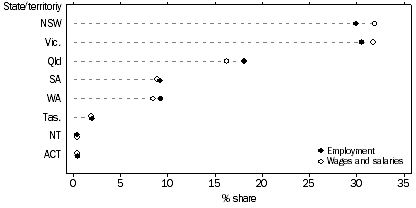
Compared to the previous year, manufacturing employment increased in 2004-05 in Victoria (by 4%), Queensland (by 5%), Western Australia (by 7%), the Northern Territory (by 5%) and the Australian Capital Territory (by 1%), and fell in New South Wales and South Australia (by 1% each). Tasmanian manufacturing employment was virtually unchanged. Wages and salaries and sales and service income increased in all states and territories, while IVA only fell in the two territories. Queensland had the largest absolute ($7.0b) and percentage (13%) increases in sales and service income. Queensland also had the largest percentage increase in IVA (15%) but was second to New South Wales ($2.4b), with an increase of $2.1b, in the absolute movement.
DISTRIBUTION OF SALES AND SERVICE INCOME AND IVA
INDUSTRY COMPOSITION
Of those industries available for publication, the industry which most heavily dominates manufacturing IVA in any state or territory is Printing, publishing and recorded media in the Australian Capital Territory (which accounts for 37% of its manufacturing IVA, compared to 10% nationally). This is followed by Machinery and equipment manufacturing in South Australia (29%; nationally 20%), and Metal product manufacturing in Western Australia (29%; nationally 19%) and Tasmania (26%). In addition, Wood and paper product manufacturing generates 24% of manufacturing IVA in Tasmania compared to 7% nationally.
Metal product manufacturing was the major manufacturing industry, as measured by share of industry value added, in three states (Queensland, Western Australia and Tasmania), and Machinery and equipment manufacturing in two others (South Australia and Victoria). Food, beverage and tobacco manufacturing was the largest manufacturing industry in New South Wales and Printing, publishing and recorded media dominated in the Australian Capital Territory. Not all subdivisions are available for publication for the two territories.
STATE AND TERRITORY COMPOSITION
An outline of the composition of manufacturing industry within each state and the Australian Capital Territory follows. Because of confidentiality restrictions, insufficient data are available for publication to allow this analysis for the Northern Territory.
NEW SOUTH WALES
Food, beverage and tobacco manufacturing is the largest manufacturing industry in New South Wales as measured by contribution to that state's manufacturing sales and service income (21%) and IVA (20%). Machinery and equipment manufacturing, however, is the largest source of manufacturing employment and wages and salaries (both 20%).
Measured by sales and service income, New South Wales businesses dominate seven of the nine manufacturing industry subdivisions. Their dominance is greatest in Printing, publishing and recorded media, to which they contribute 45% of national sales and service income, 40% of IVA, 38% of employment and 43% of wages and salaries.
VICTORIA
By all four measures presented, Machinery and equipment manufacturing is the largest manufacturing industry in Victoria, contributing 26% of its wages and salaries, 25% of manufacturing employment, 24% of sales and service income, and 23% of IVA. Food, beverage and tobacco manufacturing ranks second, with Petroleum, coal, chemical and associated product manufacturing ranking third on all measures apart from employment.
Victoria is the largest contributor to the two manufacturing industry subdivisions in which New South Wales is not dominant in terms of sales and service income. Textile, clothing, footwear and leather manufacturing is heavily concentrated in Victoria, where 44% of the industry's sales and service income and 45% of its IVA is produced. Victorian businesses are also the major sources of sales and service income in Machinery and equipment manufacturing, generating 37% and 36% of national sales and service income and IVA respectively.
QUEENSLAND
Although Food, beverage and tobacco manufacturing is the largest source of manufacturing employment (22%), wages and salaries (21%) and sales and service income (25%) in Queensland, its share of IVA (20%) is second to Metal product manufacturing (24%).
Queensland's contribution to Metal product manufacturing (20 and 21% of all four variables) exceeds its share of total manufacturing. This relative importance of Queensland reflects, in part, the location of major smelting and refining operations in that state.
SOUTH AUSTRALIA
By all four measures presented, Machinery and equipment manufacturing is the largest manufacturing industry in South Australia. Its domination of South Australian manufacturing is the most pronounced of any state or territory: 32% of South Australia's manufacturing employment, 29% of IVA, and 36% of sales and service income and 35% wages and salaries paid are attributable to Machinery and equipment manufacturing. Food, beverage and tobacco manufacturing is the second most important manufacturing industry, followed by Metal product manufacturing.
Concentration of the Motor vehicle and part manufacturing and Electrical equipment and appliance manufacturing industries in South Australia is mainly responsible for its shares of national sales and service income (15%), wages and salaries (14%) and employment (13%) for Machinery and equipment manufacturing.
WESTERN AUSTRALIA
Metal product manufacturing dominates manufacturing in Western Australia, accounting for 24%, 27%, 38% and 29% respectively of employment, wages and salaries, sales and service income and IVA. On the other hand, Petroleum, coal, chemical and associated product manufacturing is the second largest contributor to that state's manufacturing sales and service income (20%) and IVA (17%), but ranks fourth in wages and salaries (11%) and fifth (8%) in employment at the end of June. This distribution reflects, in part, the presence and capital intensity of major metal and petroleum refining operations.
TASMANIA
Tasmania is the only state or territory in which Wood and paper product manufacturing ranks in the three major manufacturing industries. It is the second largest source of manufacturing IVA (24%), wages and salaries (20%), and employment (18%), and ranks third in sales and service income (19%). The other top ranked industries are Food, beverage and tobacco manufacturing (the state's major manufacturing employer, with 22%) and Metal product manufacturing (its largest source of sales and service income).
Similarly, Tasmania's share of national aggregates for Wood and paper product manufacturing (8% of IVA, 6% of wages and salaries and sales and service income, and 5% of employment) considerably exceeds its contribution to manufacturing overall.
AUSTRALIAN CAPITAL TERRITORY
Printing, publishing and recorded media is the largest manufacturing industry in the ACT, accounting for 30% of sales and service income, 37% of IVA, 33% of wages and salaries, and 30% of employment. Of the subdivisions available for publication, Machinery and equipment manufacturing ranks second based on all variables presented.
COMPARISON ACROSS INDUSTRY
Table 3.2 shows the contribution of industries to the production (as measured by total factor income) of each state and territory, as well as Australia, in 2004-05. For the purposes of this table, the activity of general government and the ownership of dwellings are each treated as industries.
In 2004-05, the largest share of production on this basis was contributed by Property and business services, which generated 12.6% of total factor income. Of the nineteen industries shown, Manufacturing ranked second nationally, contributing 11.0%. Manufacturing was the largest industry in South Australia and Tasmania, and in New South Wales and Victoria was exceeded only by Property and business services. Mining and Property and business services both ranked ahead of Manufacturing in Queensland. South Australia (at 15.3%) had the highest proportion of state or territory production attributed to Manufacturing, followed by Tasmania (14.5%).
CHAPTER 4 EXPORTS
INTRODUCTION
This chapter illustrates the extent and importance of export activity by Australian manufacturing businesses. Table 4.1 presents estimates, for the period from 2001-02 to 2004-05, of the value of exports by Australian manufacturing businesses of goods that they produced. For 2004-05, these are dissected in Table 4.2 by employment size. Table 4.3 categorises businesses by their involvement in exporting, and presents estimates of the contribution of each category to industry aggregates. For information about how these data have been derived, please see Explanatory Notes paragraphs 33 to 37. Even though, as explained there, the exports data presented in these tables are not directly comparable with the ABS's overseas trade series, the commentary below also uses the trade series to illustrate some characteristics of Australian manufacturing's export performance.
INDUSTRY COMPARISON
The 2006 issue of the Australian Year Book (ABS cat. no. 1301.0; Table 30.27) shows that, on an industry of origin basis, Australia exported $67.4b of manufactured goods, which formed 53% of value of all goods exports in 2004-05. Manufacturing was followed by mining (32%) and agriculture (8%). In industry of origin statistics, data for a commodity are allocated to an ANZSIC industry of origin category, based on the industry which predominantly produces that commodity in Australia, as defined by the ANZSIC.
VALUE OF EXPORTS
In 2004-05, the Economic Activity Survey indicated that Australian manufacturers directly exported $49.2b worth of the goods they produced, which represents 73% of manufactured goods exports. This amounted to 18% of their value of sales of goods produced and is an increase of $906m (or 2%) compared to the value for 2003-04, when the proportion was 19%. The following graph illustrates the percentage contribution of each manufacturing industry subdivision to total manufacturing exported sales of goods produced.
EXPORTED SALES OF GOODS PRODUCED, Percentage contribution by industry subdivision
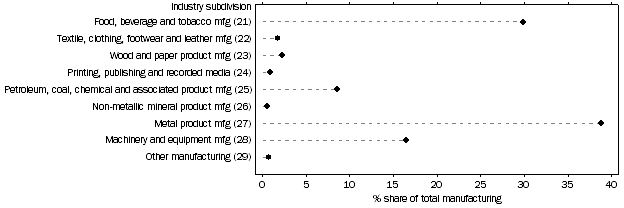
Metal product manufacturing is Australia's most heavily export-oriented manufacturing industry. In 2004-05, 34% of its sales of goods produced were exported. Businesses exporting 50% or more of sales contributed 28% of both sales and service income and IVA of Metal product manufacturing, much higher than such businesses in any other manufacturing subdivision. In terms of the proportion of its value of sales of goods produced which were exported (2%), Non-metallic mineral product manufacturing was the least export-oriented Australian manufacturing industry in 2004-05. This partly reflects the fact that many high-volume building materials, which comprise a substantial proportion of the output of this industry, are not internationally traded.
Of the nine manufacturing industry subdivisions, the value of exports of goods produced decreased between 2003-04 and 2004-05 in five and increased in the remaining four. In percentage terms, the manufacturing industry with the largest decrease in value of goods exported was Non-metallic mineral product manufacturing, exports by which fell by 29% (or $113m) to $279m. The largest absolute decrease in the value of goods exported was recorded by Wood and paper product manufacturing (down $391m, or 26%).
The value of goods exported by the Other manufacturing industry rose by 34% (or $92m) between 2003-04 and 2004-05, the largest percentage increase in manufacturing. Over the same period, Food, beverage and tobacco manufacturing recorded the greatest increase in value of goods exported in dollar terms: $1.1b, or 8%. The other industry which increased its value of exports (by 34%, or $92m) was Other manufacturing.
Over the period from 2001-02 to 2004-05, the value of goods produced and exported by Australian manufacturing businesses has increased by 6%, compared to a 19% increase in their total value of sales of goods produced. Hence the export proportion has dropped from 20.6% to 18.3%. The only manufacturing industries that increased their value of export sales over this period were Food, beverage and tobacco manufacturing (up $0.8b, or 6%), Metal product manufacturing (up $2.7b, or 17%) and Other manufacturing (up $78m, or 27%). The largest percentage decline over the period since 2001-02 was recorded by Textile, clothing, footwear and leather manufacturing (down 43%, or $659m). Petroleum, coal, chemical and associated product manufacturing experienced the greatest fall in absolute terms ($826m, or 16%), followed by Textile, clothing, footwear and leather manufacturing ($659m, or 43%).
EMPLOYMENT SIZE OF EXPORTING BUSINESSES
Excluding Metal product manufacturing (see paragraphs 33 to 37 of the Explanatory Notes), manufacturing businesses employing 100 or more persons tend to export a higher proportion (by value) of the goods that they produce, compared to businesses employing fewer than 100 persons. In 2004-05, the only exceptions to this general tendency, at the subdivision level, were Textile, clothing, footwear and leather manufacturing and Other manufacturing.
The industry subdivision in which export activity is most heavily concentrated in businesses employing 100 or more persons is Food, beverage and tobacco manufacturing, where 86% (or $12.7b) of total exports are produced by businesses in this size category. This is followed by Machinery and equipment manufacturing, where businesses in this category account for 82% (or $6.6b) of total exports. The $66m in exports produced by businesses classified to Other manufacturing represents the lowest proportion (18%) of exports produced by businesses employing 100 or more persons.
CONTRIBUTION OF BUSINESSES THAT EXPORT
Depending on the measure selected, businesses that do not export accounted for between 41% and 56% of activity at the total manufacturing level in 2004-05. The percentage contribution of non-exporting businesses was greatest, across all variables, in Printing, publishing, and recorded media, Non-metallic mineral product manufacturing and Other manufacturing.
Petroleum, coal, chemical and associated product manufacturing remains the industry in which businesses which export up to and including 50% of their sales of goods produced make the greatest contribution to the key aggregates presented.
At the total manufacturing level, businesses which exported more than 50% of their sales of goods produced tend to contribute a higher proportion to sales and service income and industry value added than to employment and wages and salaries. This pattern differs among individual industries.
 Print Page
 Print All