5519.0.55.001 - Government Finance Statistics, Australia, Jun 2018  Quality Declaration
Quality Declaration ARCHIVED ISSUE Released at 11:30 AM (CANBERRA TIME) 04/09/2018
Page tools:
 Print Page Print Page
 Print All Print All
| ||||||||||||||||||||||||||||||||||||||||||||||||||||||||||||||||||||||||||||||||||||||||||||||||||||||||||||||||||||||||||||||||||||||||||||||||||||||||||||||||||||||||||||||||||||||||||||||||||||||||||||||||||||||||||||||||||||||||||||||||||||||||||||||||||||||||||||||||||||||||||||||||||||||||||||||||||||||||||||||||||||||||||||||||||||||||||||||||||||||||||||||||||||||||||||||||||||||||||||||||||||||||||||||||||||||||||||||||||||||||||||||||||||||||||||||||||||||||||||||||||||||||||||||||||||||||||||||||||||||||||||||||||||||||||||||||||||||||||||||||||||||||||||||||||||||||||||||||||||||||||||||||||||||||||||||||||||||||||||||||||||||||||||||||||||||||||||||||||||||||||||||||||||||||||||||||||||||||||||||||||||||||||||||||||||||||||||||||||||||||||||||||||||||||||||||||||||||||||||||||||||||
|
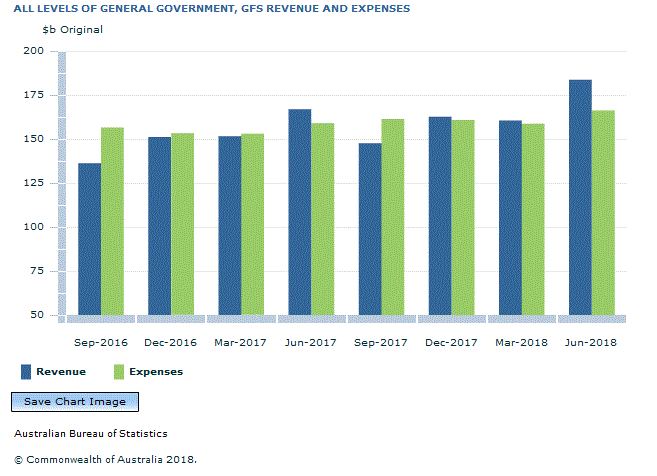
QUARTERLY GFS MEASURES - KEY FIGURES In the June quarter 2018:
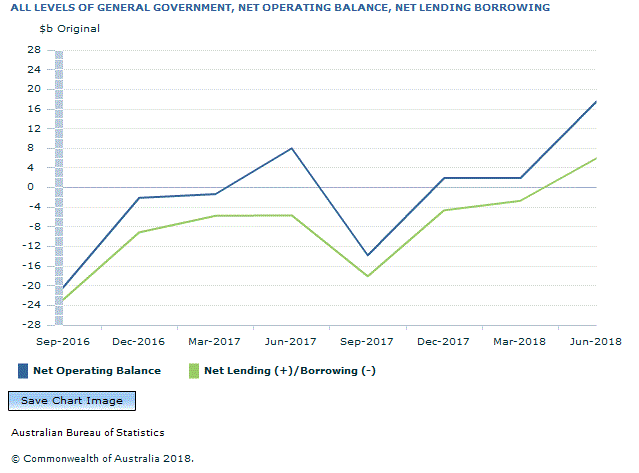 GFS KEY FIGURES, ALL LEVELS OF GOVERNMENT, ORIGINAL
BALANCE SHEET RESULTS, GENERAL GOVERNMENT SECTOR, ORIGINAL
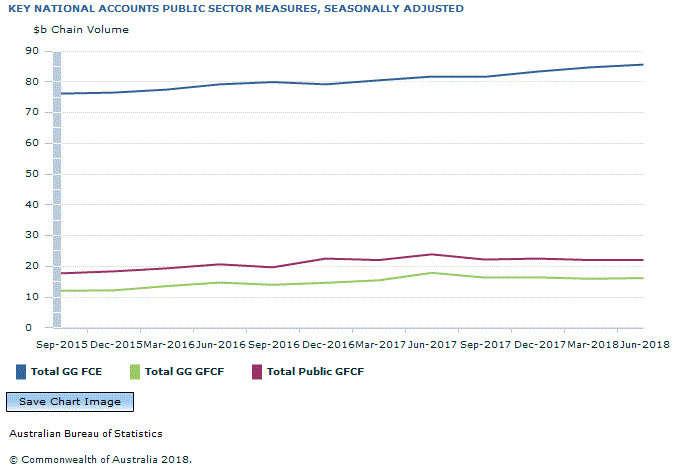
QUARTERLY NATIONAL ACCOUNTS PUBLIC SECTOR MEASURES - KEY FIGURES The table below includes the key public sector aggregates for the June quarter 2018 which will be included in the Australian National Accounts: National Income, Expenditure and Product (cat. no. 5206.0). The key figures shown include Government Final Consumption Expenditure for general government and Gross Fixed Capital Formation for general government and public corporations, seasonally adjusted in current prices and chain volume terms. The contribution to GDP of the key public sector aggregates are also included. In seasonally adjusted chain volume terms in the June quarter 2018:
QUARTERLY NATIONAL ACCOUNTS PUBLIC SECTOR MEASURES - KEY FIGURES, SEASONALLY ADJUSTED
(a) See paragraph 36 of the Explanatory Notes for the relationship between general government final consumption expenditure and GFS aggregates. (b) Reference year for chain volume measures is 2015-16. JUNE QUARTER 2018 GFS RELEASE This release presents quarterly government finance statistics on an accrual accounting basis. Tables 1 through 12 are presented in GFS operating statement format for the general government sector, with the exception of Table 2 which presents data for the public non-financial corporations sector. Tables 13 and 14 are presented in GFS balance sheet format for the general government sector. Detailed quarterly GFS are released for the current financial year only, other than in the September quarter, when the quarters of the previous financial year are presented. Balance sheet data is being added incrementally each quarter through the 2017-18 financial year. Users requiring data for earlier periods should consult the annual publication Government Finance Statistics, Australia (cat. no. 5512.0). The latest issue (2016-17) was released on 26 April 2018. RELEASE OF QUARTERLY GFS THIS ISSUE
Government Finance Statistics are part of the broader suite of macroeconomic accounts produced by the ABS. They share their basic concepts with the National Accounts and Balance of Payments. The conceptual framework is agreed internationally and published by the International Monetary Fund. Macroeconomic statistics are compiled to enable macroeconomic analysis and the standards may differ from accounting standards in some regards. CHANGES TO GOVERNMENT FINANCE STATISTICS Australia's system for producing GFS has been updated as a result of revised international standards for compiling national accounts (2008 SNA) and the consequent revision of the International Monetary Fund's GFS Manual 2014 (IMF GFSM 2014). An updated ABS GFS Manual was released on 23 December 2015 to reflect the AGFS15 changes and can be found in Australian System of Government Finance Statistics: Concepts, Sources and Methods, 2015 (cat. no. 5514.0). AGFS15 is effective for all GFS data that is reported for all periods from 1 July 2017 onwards, beginning with the September quarter 2017 publication. A range of conceptual changes under AGFS15 are outlined in the updated ABS GFS Manual. Only a small number of these changes impact on quarterly GFS data due to the narrower scope of published quarterly outputs when compared to annual outputs. Details of the changes that impact quarterly GFS data are covered in a recent Information Paper: Forthcoming Changes to the Quarterly Publication for Government Finance Statistics (cat. no. 5519.0.55.002). As part of these changes the ABS is currently considering options for the implementation of the creditor approach to interest expenses. Full implementation of the new approach will proceed across all sectors when high quality GFS outputs can be assessed. Experimental estimates for key aggregate sectors are included in the interim as a memorandum item in the publication spreadsheet so that users are aware of the potential impact on GFS outputs. These experimental estimates are sourced from the General Government Income Accounts that are produced as part of the quarterly Australian National Accounts: National Income, Expenditure and Product (cat. no. 5206.0). The Income Accounts present Other interest as an output category within Property income payable, which is broadly comparable to the Other interest expenses output category within GFS Expenses. PUBLICATION OF CURRENT QUARTER DATA BY JURISDICTION The GFS quarterly publication has historically published data for individual state and local jurisdictions with a one quarter lag before publishing. The ABS has worked closely with data providers to improve the quality of initial GFS estimates and will begin publishing current quarter data for individual state and local jurisdictions beginning with the September quarter 2018 publication. This initiative will support the timely analysis of GFS data for fiscal and macroeconomic purposes at the jurisdiction level. TRANSACTIONS RELATED TO VISA APPLICATION CHARGES In December 2015, the Commonwealth Government released the 2015-16 Mid-Year Economic and Fiscal Outlook (MYEFO) which included a reclassification of visa application charges (VAC). In MYEFO these charges are now treated as taxation revenue rather than sales of goods and services. This reclassification has been applied to the Government Finance Statistics (GFS), with no impact on total GFS revenue or the GFS net operating balance. The National Accounts statistics will maintain coherence with previously published data and classify this transaction as sales of goods and services. These treatments will remain in place until a review of the treatment of VAC across macroeconomic statistics has been completed. FORTHCOMING ISSUES The release of GFS quarterly data is usually coordinated to be the day before the respective issue of Australian National Accounts: National Income, Expenditure and Product (cat. no. 5206.0). The scheduled release dates for the next two issues are:
INQUIRIES For further information about these and related statistics, contact the National Information and Referral Service on 1300 135 070, email <client.services@abs.gov.au> or email <public.finance@abs.gov.au>. The ABS Privacy Policy outlines how the ABS will handle any personal information that you provide to us. Document Selection These documents will be presented in a new window.
|
|||||||||||||||||||||||||||||||||||||||||||||||||||||||||||||||||||||||||||||||||||||||||||||||||||||||||||||||||||||||||||||||||||||||||||||||||||||||||||||||||||||||||||||||||||||||||||||||||||||||||||||||||||||||||||||||||||||||||||||||||||||||||||||||||||||||||||||||||||||||||||||||||||||||||||||||||||||||||||||||||||||||||||||||||||||||||||||||||||||||||||||||||||||||||||||||||||||||||||||||||||||||||||||||||||||||||||||||||||||||||||||||||||||||||||||||||||||||||||||||||||||||||||||||||||||||||||||||||||||||||||||||||||||||||||||||||||||||||||||||||||||||||||||||||||||||||||||||||||||||||||||||||||||||||||||||||||||||||||||||||||||||||||||||||||||||||||||||||||||||||||||||||||||||||||||||||||||||||||||||||||||||||||||||||||||||||||||||||||||||||||||||||||||||||||||||||||||||||||||||||||||