JUNE KEY FIGURES
 | Trend estimates
| Seasonally adjusted estimates
| |
| Jun 2005 | May 2005 to Jun 2005 | Jun 2005 | May 2005 to Jun 2005 | |
| |
| Value of dwelling commitments(a) | $m | % change | $m | % change | |
| Total dwellings | 17,232 | -0.4 | 17,260 | 2.0 | |
| Owner occupied housing | 11,699 | -0.1 | 11,651 | 0.8 | |
| Investment housing - fixed loans(b) | 5,533 | -1.0 | 5,609 | 4.7 | |
| Number of dwelling commitments(a) | no. | % change | no. | % change | |
| Owner occupied housing | 55,260 | -0.1 | 54,436 | -0.9 | |
| Construction of dwellings | 4,594 | 0.4 | 4,545 | -1.5 | |
| Purchase of new dwellings | 2,255 | 1.4 | 2,222 | -1.6 | |
| Purchase of established dwellings | 48,411 | -0.2 | 47,669 | -0.9 | |
| |
| (a) Includes refinancing. |
| (b) Excludes revolving credit. |
Housing finance, Value of dwellings
| Owner occupied housing finance, Number of dwellings
|
JUNE KEY POINTS
TREND ESTIMATES
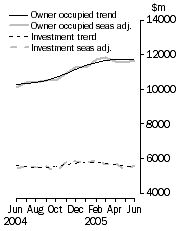
- Total value of dwelling finance commitments excluding alterations and additions decreased by 0.4% in June 2005, the third consecutive monthly decrease. Owner occupied housing decreased by 0.1%, while investment housing fell by 1.0%.
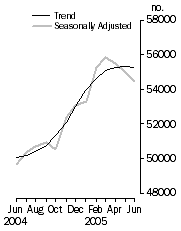
- The number of commitments for owner occupation decreased by 0.1% in June 2005, while the number excluding refinancing fell by 0.6%.
SEASONALLY ADJUSTED ESTIMATES
- Total value of dwelling finance commitments excluding alterations and additions rose by 2.0% in June 2005.
- Investment housing commitments increased by 4.7%, driven primarily by increases in purchase of dwellings for rent or resale by individuals (up $134m, 3.1%) and construction of dwellings for rent or resale (up $125m, 20.7%). The value of owner occupied housing commitments increased by 0.8%.
- The number of commitments for owner occupation decreased by 0.9% in June 2005, while the number excluding refinancing rose by 0.4%.
ORIGINAL ESTIMATES
- First home buyer commitments as a percentage of total commitments fell slightly to 16.4% in June 2005. The percentage of the number of commitments for owner-occupied housing at a fixed rate of interest (for at least two years) decreased from 11.4% in May to 10.3% in June.
NOTES
CHANGES IN THIS ISSUE
Data quality assurance procedures identified misreporting in the number of owner occupied housing commitments for May, which the relevant data provider was not able to correct. As a result, the ABS has imputed the number of owner occupied housing commitments for May for this provider, resulting in downward revisions to the number of established dwellings for May.
INQUIRIES
For further information about these and related statistics, contact the National Information and Referral Service on 1300 135 070 or Michael Abbondante on (02) 6252 6707.
SUMMARY COMMENTARY
SUMMARY OF FINDINGS
DWELLINGS FINANCED
Value of Dwellings Financed
The total value of dwelling commitments excluding alterations and additions (seasonally adjusted) increased by 2.0% in June 2005. The total housing finance trend decreased by 0.4%, the third consecutive month of slight decreases.
The total value of owner occupied commitments (seasonally adjusted) increased by 0.8% (up $88m) in June 2005, following a decrease of 0.6% in May. The increase in purchase of established dwellings excluding refinancing (up $156m, 2.3%) more than offset increases in refinancing of established dwellings (down $44m, -1.3%), purchase of new dwellings (down $20m, -3.8%) and construction of dwellings (down $3m, -0.3%). The trend series in the value of owner occupied commitments fell by 0.1% in June, the first decrease since March 2004.
The seasonally adjusted series for value of investment housing commitments (including finance for construction and finance for rent or resale) increased by 4.7% (up $253m) in June 2005, following a fall of 6.6% in May. The increase this month was due to increases in the purchase of dwellings for rent or resale by individuals (up $134m, 3.1%) and construction of dwellings for rent or resale (up $125m, 20.7%) more than offsetting a small decrease in the purchase of dwellings for rent or resale by others (down $6m, -1.5%). The trend series in total value of investment commitments fell by 1.0%, the fifth consecutive monthly decrease.
Number of Owner Occupied Dwellings Financed
The number of owner occupied dwelling commitments (seasonally adjusted) decreased by 0.9% (down 520) in June 2005, the third consecutive monthly decrease. The decreases in the refinancing of established dwellings (down 668, -3.9%), construction of dwellings (down 69, -1.5%) and purchase of new dwellings (down 35, -1.6%) more than offset the increase in purchase of established dwellings excluding refinancing (up 252, 0.8%). The total owner occupied housing finance trend fell by 0.1% in June 2005, the first decrease since June 2004.
Decreases were recorded in seasonally adjusted terms in Western Australia (down 224, -2.9%), Victoria (down 182, -1.4%), Tasmania (down 120, -10.1%), South Australia (down 85, -1.9%), Australian Capital Territory (down 26, -4.1%) and Queensland (down 14, -0.1%). These decreases were partially offset by an increase in Northern Territory (up 41, 7.5%), while New South Wales remained virtually unchanged. The trend decreased in all states and territories except Victoria, Western Australia and Northern Territory.
In original terms, first home buyer commitments as a percentage of total owner occupied housing commitments fell slightly to 16.4% in June 2005. The percentage of commitments at a fixed rate of interest (for at least two years) decreased from 11.4% in May to 10.3% in June.
Number of Owner Occupied Dwellings Financed Excluding Refinancing
The number of owner occupied dwellings financed excluding refinancing (seasonally adjusted) increased by 0.4% in June 2005, following a decrease of 1.2% in May. The trend decreased by 0.6% in June 2005.
PURPOSE OF FINANCE (OWNER OCCUPATION)
Construction of dwellings
The seasonally adjusted number of construction commitments for owner occupation fell by 1.5% in June 2005, following an increase of 1.7% in May. The trend series increased by 0.4% in June 2005.
Purchase of new dwellings
The number of finance commitments for the purchase of new dwellings for owner occupation (seasonally adjusted) fell by 1.6% in June 2005, following a rise of 1.9% in May. The trend series rose by 1.4% in June 2005.
Purchase of established dwellings
The seasonally adjusted established dwelling for owner occupation series decreased by 0.9% in June 2005, the third consecutive monthly decrease. The trend fell by 0.2% in June 2005, the second slight decrease following a run of increases starting in July 2004.
Refinancing
The number of refinancing commitments for owner occupied housing (seasonally adjusted) fell by 3.9% in June 2005, following a fall of 0.6% in May. Trend series rose by 0.9% in June 2005.
TYPE OF LENDER (OWNER OCCUPATION)
Banks
The number of owner occupied dwellings financed by banks (seasonally adjusted) decreased by 1.4% in June 2005, following a decrease of 2.1% in May 2005. The trend series remained virtually unchanged in June.
Non-banks
Non-bank commitments for owner occupied housing (seasonally adjusted) increased by 0.4% in June 2005, following an increase of 2.8% in May. Wholesale lenders were up 2.1% while permanent building societies were down 7.6%. The non-bank trend series decreased by 0.3% in June 2005, the fourth consecutive monthly decrease.
HOUSING LOAN OUTSTANDINGS
At the end of June 2005, housing loans outstanding of authorised deposit-taking institutions was $522,619m, up $5,665m (1.1%) from May's closing balance. Owner occupied housing loans increased by $3,851m (1.1%) to close at $348,693m, while investment housing loans outstanding increased by $1,814m (1.1%) to reach a closing balance of $173,926m.
Bank loans increased by $5,544m (1.1%) during June to a closing stock of $491,836m. Owner occupied housing loans of banks increased by $3,763m (1.2%) to $323,979m, while investment housing loans increased $1,781m (1.1%) to $167,857m.
 Print Page
 Print All