|
|
Differences in Recorded Crime Statistics
NOTES
ABOUT THIS PUBLICATION
This publication presents national crime statistics relating to victims of a selected range of offences that have been recorded by police. These statistics provide indicators of the level and nature of recorded crime victimisation in Australia and a basis for measuring change over time. As not all crimes are reported to or recorded by police, other data sources can assist in providing a more comprehensive view of the level of crime in society. This is explained further in the Measuring Crime Victimisation section.
INTERPRETATION OF RESULTS
The statistics contained in this publication are derived from administrative systems maintained by state and territory police. Although national standards and classifications are used, some discrepancies remain between the states and territories. These are due to legislative and procedural differences and affect comparisons of data between jurisdictions for some offence types.
The Australian Bureau of Statistics (ABS) National Crime Statistics Unit (NCSU) recently completed a project that investigated the reasons for differences in the levels of recorded crime across jurisdictions. The ABS is working with police agencies to further develop the national crime reporting standards to provide more consistency in methodology.
Differences over time in the level of recorded crime may reflect factors other than change in the incidence of crime. They can also be the result of changes to police recording practices and systems. As well, when police form special task forces to combat particular offences or implement proactive policing campaigns to encourage reporting there may be short term effects on the level of crime recorded by police in the period.
CHANGES IN THIS ISSUE
Following completion of the project investigating differences in recorded crime statistics, numbers and rates per 100,000 persons are only presented by state and territory for those offences that are currently comparable across jurisdictions. These offences are homicide and related offences, kidnapping/abduction, robbery, blackmail/extortion, unlawful entry with intent, motor vehicle theft and other theft. For this issue the offences of assault and sexual assault have been excluded due to differences in recording across states and territories. Refer to Explanatory Notes paragraphs 14 to 21 for further detail.
FURTHER INFORMATION
More information about ABS activities in the field of crime and justice statistics is available from the Crime and Justice theme page on the ABS web site. To access the theme page, select Themes from the menu on the home page. Details of other ABS publications relating to crime and justice statistics can be found in paragraph 74 of the Explanatory Notes.
ACKNOWLEDGMENTS
The ABS acknowledges the valuable contribution of the Board of Management of the NCSU, the National Crime Statistics Advisory Group and the staff of the various agencies that provide the statistics that are presented in this publication.
INQUIRIES
For further information about these and related statistics, contact the National Information and Referral Service on 1300 135 070 or Marika Woodberry on Melbourne (03) 9615 7381.
MEASURING CRIME VICTIMISATION
DEFINING AN INCIDENT
Following an incident of crime, there are a number of stages at which it can be measured. As a result, there are a number of different sources of statistics on crime victimisation, from the time that a person perceives they have been a victim through to reporting to police and the laying of charges. Recorded crime data provides one measure relating to those crimes reported to and recorded by police.
Further, crime is a complex social issue and difficult to measure with a single set of numbers. Using a variety of measures from these different stages can provide a comprehensive view of crime, and can provide greater insight into what influences change.
All criminal events, broadly defined
At the broadest level there are a range of events that occur in the community that can be classified as criminal events. It is not possible to obtain accurate measures of these events, as not all incidents that could be described as criminal events will be identified or perceived as such. For example, a fire may or may not be considered a criminal event depending on the presence of suspicious circumstances.
Incidents perceived and self-classified by victims as crime
What a victim perceives to be an offence can be quite personal and will depend on the victim's sensitivity to crime. Cultural factors and life experience as well as the impact on the victim will all contribute to the victim perceiving an event as a crime. For example, a person whose partner regularly threatens physical force against them may not perceive this to be a crime.
Incidents of crime reported to police
Many factors influence whether or not a victim will report an incident they perceive as a crime to police, and these factors change for different offences. The victim's desire for further action, and their perception of police willingness and ability to deal with the incident, can impact on the victim reporting the incident to police. Reporting of property offences will also be influenced by external factors such as insurance company requirements for police reports prior to processing claims. Victims of personal crimes are much less likely to report the offence to police than victims of property crimes.
Incidents of crime reported in crime victimisation surveys
As crime victimisation surveys are usually designed to collect information from people in households, they provide an opportunity to measure experiences of crime beyond those reported to police. However, the victim's perception of crime will still play a large part in the reporting of a crime in victimisation surveys. Other factors will also contribute, for example the respondent's ability to understand the question due to language barriers. Differences may also occur because respondents answer incorrectly to protect their personal integrity, their personal safety or to protect another person. For example, respondents may not report incidents they have experienced, particularly if the perpetrator was somebody close to them such as a partner or family member, and particularly if there is a perception that the perpetrator will in some way gain access to the responses they provide.
Incidents of crime recorded by police as crimes
Further, incidents that are reported to police are not always recorded on police recording systems as crimes. This may be because investigation indicates that no offence has occurred, or that the offence reported is in actual fact another offence altogether. Recording practice, systems and legislation all contribute to differences occurring at this stage, and the level of crime reported is not always consistent across offence types or jurisdictions.
COMPARING RECORDED CRIME AND SURVEY RESULTS
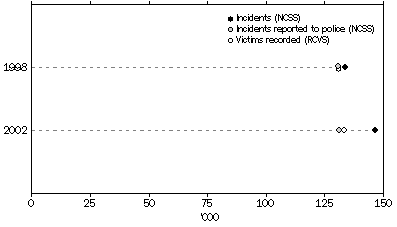
The different levels of crime measured at different stages are apparent when data from the National Crime and Safety Survey (NCSS) and Recorded Crime Victims Statistics (RCVS) are compared. Data from these collections are presented in the charts below for motor vehicle theft and robbery for two reference periods, 1998 and 2002.
The graph for motor vehicle theft indicates that there was some difference between the incidents that occurred and the incidents that were reported to police in 2002. However, this difference is not statistically significant. The estimate for the number of motor vehicle thefts reported is not different to the number recorded by police for either reference period. For motor vehicle theft there is very little difference between levels of crime reported in surveys and those reported to police.
MOTOR VEHICLE THEFT, Australia
The picture for robbery, however, is very different. There are significant differences between the incidents reported in surveys compared to those reported to police, and recorded by police. All three victimisation measures are greater for 2002 than for 1998. The movement over time is consistent for each of the measures for this offence, indicating that movement in recorded crime is likely to be due to a change in the underlying offence rate.
ROBBERY, Australia
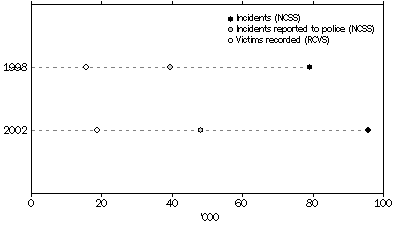 (Note: Data from the RCVS and NCSS has been adjusted for comparability)
While the patterns over time, and between recorded, reported and unreported crime, will vary for different offences, most jurisdictions display consistent trends for particular offences. However, for some offences such as assault, there are significant differences between jurisdictions.
As highlighted by these examples, care is required when interpreting recorded crime victimisation statistics. The statistics presented in this publication should be considered in terms of the wider context and the methodological issues described in this section and in the Explanatory Notes.
OTHER MEASUREMENT ISSUES
As the Recorded Crime Victims Statistics (RCVS) collection is based on information that was recorded by police, it is important to note that the statistics include records of alleged offences which may later be withdrawn or proven to have no basis. In addition, fluctuations in recorded crime may be influenced by changes in community attitudes in reporting crime, in police procedures and in crime recording systems, rather than changes in the incidence of criminal behaviour. Users are referred to the Explanatory Notes for more detail on the exact scope and coverage of the statistics (paragraphs 22 to 26) and the counting methodology applied (paragraphs 34 to 43).
Depending on the type of offence, a victim may be a person, a premise, an organisation or a motor vehicle. It is also possible that a person within the one criminal incident is counted multiple times. This would occur when the victim is subject to multiple offence types, for example they were robbed and abducted, in which case they would be counted as a victim of robbery and of kidnapping/abduction. For these reasons, it is not meaningful to aggregate the number of victims across each offence type and produce a 'total number of victims'; it is only meaningful to look at victim counts within each offence category.
SUMMARY OF FINDINGS
INTRODUCTION
This publication presents statistics on victims of a selected range of offences which were recorded by state and territory police in Australia for the period 1 January 2004 to 31 December 2004. Data are also provided for individual years from 1995 onwards.
RECORDED NATIONAL CRIME LEVELS
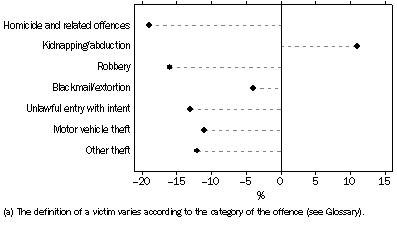
The number of victims recorded by Australian police declined in most offence categories in 2004 when compared to 2003. Robbery decreased by 16% and unlawful entry with intent decreased by 13%. Other offence categories to record a decrease in the number of victims included other theft (12%), motor vehicle theft (11%) and blackmail/extortion (4%). Victims of homicide and related offences decreased by 19% and victims of kidnapping/abduction increased by 11%. However, for both of these crimes, small numbers are recorded and they are therefore subject to greater variation from year to year than other offence categories.
VICTIMS(a), Percentage change in number - 2003 to 2004
Other theft (which includes theft from persons, retail premises and motor vehicles) continues to be numerically the largest offence category. In 2004 there were 547,800 recorded victims of other theft, a decrease of just over 76,000 since 2003.
In 2004, the victimisation rates for unlawful entry with intent (1,534 per 100,000 population), motor vehicle theft (437 per 100,000 population) and homicide and related offences (4 per 100,000 population) were the lowest since national reporting began in 1993. The victimisation rates for robbery (82 per 100,000 population) and other theft (2,724 per 100,000 population) were the lowest since 1996.
RECORDED CRIME VICTIM CHARACTERISTICS
Sex and age of victim
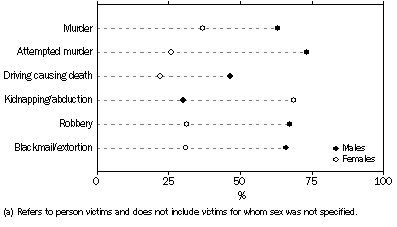
More males than females were victims of robbery (67% of victims were male), blackmail/extortion (66%), attempted murder (73%) and murder (63%). For kidnapping/abduction, more females were victims than males (69% of victims were female).
VICTIMS(a), Offence categories by sex
Persons aged 25 years or older comprised approximately two in three recorded victims of attempted murder, murder and blackmail/extortion. In contrast, this age group comprised only one in four victims of kidnapping/abduction. Kidnapping/abduction had the highest proportion of victims aged 0-14 (31%).
VICTIMS(a), Offence categories by age group
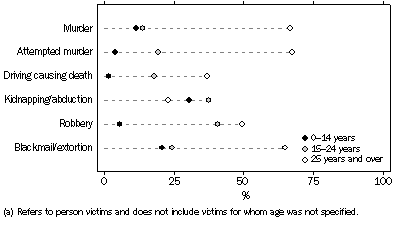
The victimisation rates displayed further variation across certain offence categories when classified by age and sex. Persons aged 15-19 years were more than three times more likely to be victims of robbery than the general population. The victimisation rate for robbery was the highest in the 20-24 year age group for females (101 per 100,000 population) but highest in the 15-19 year age group for males (342 per 100,000 population).
LOCATION OF OFFENCE
VICTIMS(a), Offences occurring at residential and community locations
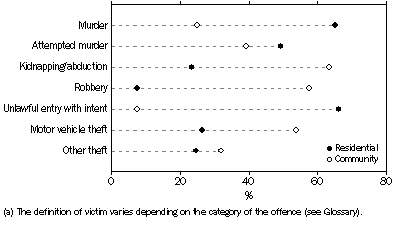
In 2004, for victims of motor vehicle theft, the location was most likely to be a community location (54%) followed by a residential location (26%). For unlawful entry with intent, the location was most likely to be a residential location (66%), while for robbery more than half of the victims were subjected to the offence in a community location.
Victims of murder and attempted murder were most likely to have been subjected to the offence in a residential location. More than three in five victims of kidnapping/abduction were taken from a community location, with less than one in four taken from a residential location.
OUTCOME OF INVESTIGATION
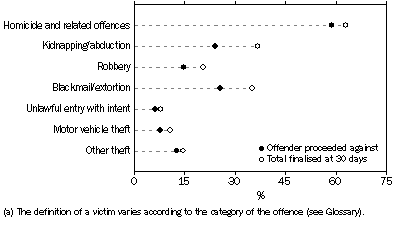
In 2004, approximately two-thirds of the investigations into murder (65%), attempted murder (64%) and driving causing death (62%) had been finalised within 30 days after a victim became known to police. The lowest proportions of finalisations at 30 days were for victims of unlawful entry with intent (8%), motor vehicle theft (11%) and other theft (14%).
Of those investigations finalised, police were most likely to have proceeded against an offender at 30 days for victims of homicide and related offences: manslaughter (100%), attempted murder (96%), driving causing death (95%) and murder (87%). Victims of unlawful entry with intent, motor vehicle theft and other theft had a low proportion finalised at 30 days, but of those that were finalised, a high proportion were proceeded against by police - other theft (86%), unlawful entry with intent (80%) and motor vehicle theft (71%). The highest proportions of investigations finalised where there was no offender proceeded against were for victims of kidnapping/abduction (35%), motor vehicle theft (29%) and robbery (28%).
VICTIMS(a), Outcome of investigation at 30 days
WEAPON USE
In 2004, a weapon was most likely to have been used in attempted murder (73%) and murder (59%). A knife was the most common type of weapon used and was involved in 32% of attempted murders, 28% of murders, 18% of robberies and 6% of kidnappings/abductions. A firearm was involved in 23% of attempted murders, 13% of murders, 5% of robberies and 2% of kidnappings/abductions.
VICTIMS(a), Weapon used in commission of offence
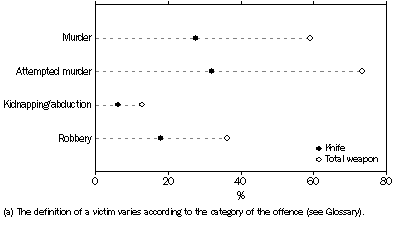
The proportion of murders involving a weapon peaked in 1996 at 78% while the proportion of attempted murders involving a weapon peaked in 1997 at 87%.
The proportion of robberies in which a weapon was used increased from 36% in 1995 to 46% in 1998 and has since generally declined to 36% in 2004. For those robberies that involved a weapon, the proportion involving a firearm decreased from 28% in 1995 to 14% in 2000, and has been stable from 2000 to 2004 at 15%. The proportion of kidnappings/abductions where a weapon was used also fluctuated from 11% in 1995 to 23% in 1999. Since 1999, this proportion has declined to 13% in 2004.
A firearm was used in 5% of robberies recorded in 2004, the lowest proportion since national reporting began in 1993. The proportion of murders involving a firearm was 13% in 2004. This has decreased significantly since 1996 when 32% of murders involved a firearm. For attempted murders in 2004, a firearm was used in 23% of offences, marginally above its low of 19% in 1998 and well below its high of 31% in 1999.
VICTIMS(a), Firearm used in commission of offence
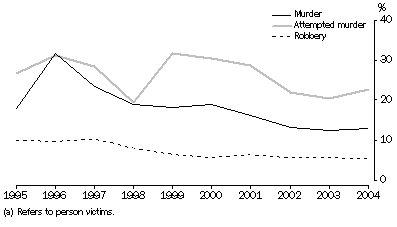
TABLE 1 VICTIMS(a), Offence category by states and territories—2004
|  |
 |  | NSW | Vic. | Qld | SA | WA | Tas. | NT | ACT | Aust. |  |
|  |
NUMBER |  |
|  |
| Homicide and related offences | 227 | 156 | 199 | 91 | 75 | 18 | 17 | 6 | 789 |  |
 | Murder | 72 | 51 | 55 | 28 | 34 | 7 | 9 | – | 256 |  |
 | Attempted murder | 75 | 44 | 95 | 52 | 30 | 8 | – | 3 | 307 |  |
 | Manslaughter | 4 | 3 | 11 | – | 11 | – | 8 | – | 37 |  |
 | Driving causing death | 76 | 58 | 38 | 11 | – | 3 | – | 3 | 189 |  |
| Kidnapping/abduction | 464 | 110 | 114 | 36 | 25 | 7 | 6 | 6 | 768 |  |
| Robbery | 8,887 | 2,289 | 1,929 | 1,239 | 1,744 | 126 | 58 | 218 | 16,490 |  |
 | Armed Robbery | 2,867 | 1,108 | 869 | 505 | 465 | 49 | 24 | 106 | 5,993 |  |
 | Unarmed Robbery | 6,020 | 1,181 | 1,060 | 734 | 1,279 | 77 | 34 | 112 | 10,497 |  |
| Blackmail/extortion | 94 | 92 | 59 | 44 | 73 | – | 3 | 5 | 370 |  |
| Unlawful entry with intent(c) | 110,765 | 56,047 | 56,589 | 26,728 | 44,625 | 4,988 | 3,424 | 5,202 | 308,368 |  |
 | UEWI-Involving the taking of property | 84,044 | 41,968 | 42,587 | 17,030 | 28,729 | 3,860 | 1,840 | 4,580 | 224,638 |  |
 | UEWI-Other | 26,721 | 14,079 | 14,002 | 9,698 | 15,896 | 1,128 | 1,584 | 622 | 83,730 |  |
| Motor vehicle theft | 33,209 | 20,070 | 12,452 | 10,511 | 7,730 | 1,731 | 467 | 1,746 | 87,916 |  |
| Other theft | 170,290 | 120,179 | 100,288 | 52,500 | 78,749 | 11,033 | 6,421 | 8,340 | 547,800 |  |
|  |
RATE PER 100,000 PERSONS |  |
|  |
| Homicide and related offences | 3.4 | 3.1 | 5.1 | 5.9 | 3.8 | 3.7 | 8.5 | 1.9 | 3.9 |  |
 | Murder | 1.1 | 1.0 | 1.4 | 1.8 | 1.7 | 1.5 | 4.5 | – | 1.3 |  |
 | Attempted murder | 1.1 | 0.9 | 2.4 | 3.4 | 1.5 | 1.7 | – | 0.9 | 1.5 |  |
 | Manslaughter | 0.1 | 0.1 | 0.3 | – | 0.6 | – | 4.0 | – | 0.2 |  |
 | Driving causing death | 1.1 | 1.2 | 1.0 | 0.7 | – | 0.6 | – | 0.9 | 0.9 |  |
| Kidnapping/abduction | 6.9 | 2.2 | 2.9 | 2.3 | 1.3 | 1.5 | 3.0 | 1.9 | 3.8 |  |
| Robbery | 132.0 | 46.0 | 49.7 | 80.8 | 88.0 | 26.1 | 29.0 | 67.3 | 82.0 |  |
 | Armed Robbery | 42.6 | 22.3 | 22.4 | 32.9 | 23.5 | 10.2 | 12.0 | 32.7 | 29.8 |  |
 | Unarmed Robbery | 89.4 | 23.7 | 27.3 | 47.8 | 64.5 | 16.0 | 17.0 | 34.6 | 52.2 |  |
| Blackmail/extortion | 1.4 | 1.9 | 1.5 | 2.9 | 3.7 | – | 1.5 | 1.5 | 1.8 |  |
| Unlawful entry with intent(c) | 1,645.5 | 1,127.1 | 1,457.7 | 1,742.1 | 2,251.3 | 1,034.6 | 1,712.7 | 1,605.5 | 1,533.5 |  |
 | UEWI-Involving the taking of property | 1,248.6 | 844.0 | 1,097.0 | 1,110.0 | 1,449.3 | 800.6 | 920.4 | 1,413.5 | 1,117.1 |  |
 | UEWI-Other | 397.0 | 283.1 | 360.7 | 632.1 | 801.9 | 234.0 | 792.3 | 192.0 | 416.4 |  |
| Motor vehicle theft | 493.4 | 403.6 | 320.8 | 685.1 | 390.0 | 359.0 | 233.6 | 538.9 | 437.2 |  |
| Other theft | 2,529.8 | 2,416.7 | 2,583.4 | 3,421.9 | 3,972.8 | 2,288.4 | 3,211.9 | 2,573.9 | 2,724.2 |  |
|  |
| – nil or rounded to zero (including null cells). |  |
(a) The definition of a victim varies according to the category of the offence (see Glossary).
(b) The data presented in this publication have been confidentialised to prevent identification of victims (see Explanatory Notes paragraphs 32 and 33). |  |
| (c) For South Australia, Tasmania and the Australian Capital Territory, some instances of unlawful entry with intent (UEWI) offences may be recorded by police as trespass, which is out of scope for this collection (see Explanatory Notes paragraphs 54, 63 and 70). |  |
|
 Print Page
 Print All