|
|
DECEMBER KEY FIGURES
 | Dec 04 | Nov 04 to Dec 04 | Dec 03 to Dec 04 |
| no. | % change | % change |
Trend |
|
| Total dwelling units approved | 12,415 | -1.1 | -16.4 |
| Private sector houses | 8,435 | -1.1 | -15.8 |
| Private sector other dwellings | 3,557 | -1.5 | -21.6 |
Seasonally Adjusted |
|
| Total dwelling units approved | 13,060 | 2.7 | -11.3 |
| Private sector houses | 8,217 | -5.6 | -19.8 |
| Private sector other dwellings | 4,464 | 27.0 | 10.1 |
|
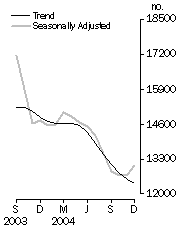
Dwelling units approved
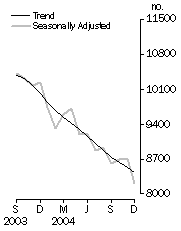
| Private sector houses approved
|
DECEMBER KEY POINTS
TOTAL DWELLING UNITS
- The trend estimate for total dwelling units approved fell 1.1% in December 2004. The trend has fallen for the last eight months.
- The seasonally adjusted estimate for total dwelling units approved rose 2.7%, to 13,060, in December 2004.
PRIVATE SECTOR HOUSES
- The trend estimate for private sector houses approved fell 1.1% in December 2004. The trend has now fallen for fifteen consecutive months.
- The seasonally adjusted estimate for private sector houses approved fell 5.6%, to 8,217, in December 2004. This is the lowest estimate since May 2001.
PRIVATE SECTOR OTHER DWELLING UNITS
- The trend estimate for private sector other dwellings approved fell 1.5% in December 2004. The trend has fallen for the last seven months, although the rate of decline slowed in December 2004.
- The seasonally adjusted estimate for private sector other dwellings approved rose 27.0%, to 4,464, in December 2004. This rise only partially offsets the declines of the previous six months. Some large approvals in New South Wales, Queensland and the Australian Capital Territory contributed to the increase.
VALUE OF BUILDING APPROVED
- The seasonally adjusted estimate of the value of total building approved fell 1.4%, to $4,134.4m, in December 2004. The value of new residential building approved rose 8.0%, to $2,541.6m.
NOTES
CHANGES IN THIS ISSUE
There are no changes in this issue.
REVISIONS THIS MONTH
Revisions have been made to total dwelling units in this issue:
| 2003-04 | 2004-05 | TOTAL |
|
| New South Wales | 9 | 4 | 13 |
| Victoria | -2 | -33 | -35 |
| Queensland | 3 | -69 | -66 |
| South Australia | -1 | 6 | 5 |
| Western Australia | -1 | -1 | -2 |
| Tasmania | - | - | - |
| Northern Territory | -1 | - | -1 |
| Australian Capital Territory | - | - | - |
| TOTAL | 7 | -93 | -86 |
|
A downward revision of $100m in September 2004 for non-residential building in Victoria was made when further investigation identified this work as engineering construction activity.
DATA NOTES
Estimates have been included in this issue for two councils unable to report all building work approved in their municipalities this month (Campbelltown in New South Wales and Light in South Australia).
INQUIRIES
For further information about these and related statistics, contact the National Information and Referral Service on 1300 135 070 or David Finlay on Adelaide (08) 8237 7431.
SUMMARY COMMENTARY
SUMMARY COMMENTARY
VALUE OF BUILDING APPROVED
NEW RESIDENTIAL BUILDING
The trend estimate of the value of new residential building rose 0.5% in December 2004, after seven months of decline.
ALTERATIONS AND ADDITIONS TO RESIDENTIAL BUILDING
The trend estimate of the value of alterations and additions to residential building is now relatively flat after five months of decline. The trend rose 0.2% in December 2004.
NON-RESIDENTIAL BUILDING
The trend estimate of the value of non-residential building is now showing four months of decline, falling 1.8% in December 2004.
DWELLINGS APPROVED
TOTAL DWELLING UNITS
The trend estimate for total dwelling units approved is showing a decline over the last eight months.
PRIVATE SECTOR HOUSES
The trend estimate for private sector houses approved has shown a decline for the last fifteen months. The trend fell 1.1% in December 2004.
PRIVATE SECTOR OTHER DWELLINGS
The trend estimate for private sector other dwellings approved has fallen for the past seven months, with the decline slowing in recent months. The trend fell 1.5% in December 2004.
DWELLING UNITS APPROVED - STATES AND TERRITORIES
SUMMARY COMMENTS
The trend estimate for total dwelling units approved fell 1.1% in December 2004. The trend fell in all states and territories except Tasmania (+4.2%) and the Australian Capital Territory (+19.8%).
The trend estimate for private sector houses approved fell 1.1% in December 2004. The trend fell in New South Wales (-1.9%), Victoria (-2.5%) and Queensland (-1.5%). These falls were partially offset by rises in South Australia (+1.1%) and Western Australia (+1.6%).
| | NSW | Vic. | Qld | SA | WA | Tas. | NT | ACT | Aust. | |
Original | |
| |
| Dwelling units approved | | | | | | | | | | |
| Private sector houses (no.) | 1,515 | 2,011 | 1,686 | 719 | 1,531 | 201 | 26 | 72 | 7,761 | |
| Total dwelling units (no.) | 3,143 | 2,847 | 3,058 | 874 | 1,951 | 259 | 114 | 544 | 12,790 | |
| Percentage change from previous month | | | | | | | | | | |
| Private sector houses (%) | -15.7 | -24.9 | -20.8 | -2.0 | -8.5 | -6.9 | -7.1 | 18.0 | -16.7 | |
| Total dwelling units (%) | 6.0 | -19.6 | -2.2 | -3.1 | 1.4 | -4.4 | 28.1 | 98.5 | -2.3 | |
Seasonally Adjusted | |
| |
| Dwelling units approved | | | | | | | | | | |
| Private sector houses (no.) | 1,534 | 2,186 | 1,924 | 721 | 1,554 | na | na | na | 8,217 | |
| Total dwelling units (no.) | 2,966 | 3,022 | 3,331 | 876 | 1,949 | 252 | na | na | 13,060 | |
| Percentage change from previous month | | | | | | | | | | |
| Private sector houses (%) | -2.1 | -13.3 | -8.8 | 6.1 | 0.6 | na | na | na | -5.6 | |
| Total dwelling units (%) | 0.8 | -10.7 | 6.1 | 3.4 | 8.8 | - | na | na | 2.7 | |
Trend | |
| |
| Dwelling units approved | | | | | | | | | | |
| Private sector houses (no.) | 1,525 | 2,326 | 2,055 | 681 | 1,555 | na | na | na | 8,435 | |
| Total dwelling units (no.) | 2,776 | 3,254 | 3,204 | 820 | 1,875 | 250 | 97 | 139 | 12,415 | |
| Percentage change from previous month | | | | | | | | | | |
| Private sector houses (%) | -1.9 | -2.5 | -1.5 | 1.1 | 1.6 | na | na | na | -1.1 | |
| Total dwelling units (%) | -2.3 | -1.3 | -1.6 | -1.6 | -0.5 | 4.2 | -4.9 | 19.8 | -1.1 | |
| |
| - nil or rounded to zero (including null cells) |
| na not available |
DWELLING UNITS APPROVED
State Trends
NEW SOUTH WALES
The trend estimate for total dwelling units approved in New South Wales has fallen for the last nine months. The trend for private sector houses is showing declines for the last sixteen months.
VICTORIA
The trend estimate for total dwelling units in Victoria is showing a decline over the past fifteen months. The trend for private sector houses shows a decline over the past sixteen months.
QUEENSLAND
The trend estimate for total dwelling units approved in Queensland is showing a general decline over the last fifteen months. The trend for private sector houses is now showing a decline over the last fourteen months.
SOUTH AUSTRALIA
The trend estimate for total dwelling units approved in South Australia shows a steady decline over the past six months. The trend for private sector houses is now showing a rise over the past three months.
WESTERN AUSTRALIA
The trend estimate for total dwelling units approved in Western Australia shows a decline over the past seven months. The trend for private sector houses shows a rise over the past five months.
|
 Print Page
 Print All