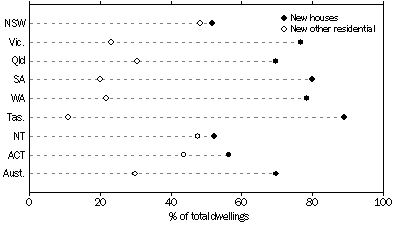
DWELLINGS APPROVED BY TYPE OF DWELLING 2006–07
STATES AND TERRITORIES
The number of dwelling units approved in the States and Territories during 2006-07 is shown in the table below, for each type of dwelling category.
 |  | NSW | Vic. | Qld | SA | WA | Tas. | NT | ACT | Aust. |  |
 |  | no. | no. | no. | no. | no. | no. | no. | no. | no. |  |
|  |
| New houses | 15 888 | 28 812 | 28 719 | 8 590 | 19 494 | 2 508 | 762 | 1 265 | 106 038 |  |
| New semidetached, row or terrace houses, townhouses etc of: |  |  |  |  |  |  |  |  |  |  |
 | One storey | 2 203 | 2 226 | 1 885 | 1 286 | 1 812 | 220 | 111 | 159 | 9 902 |  |
 | Two or more storeys | 3 652 | 2 279 | 3 573 | 383 | 952 | 50 | 113 | 84 | 11 086 |  |
 | Total | 5 855 | 4 505 | 5 458 | 1 669 | 2 764 | 270 | 224 | 243 | 20 988 |  |
| New flats, units, apartments in a building of: |  |  |  |  |  |  |  |  |  |  |
 | One or two storeys | 579 | 402 | 883 | 137 | 404 | 37 | 11 | 26 | 2 479 |  |
 | Three storeys | 1 134 | 794 | 1 535 | 203 | 292 | - | 24 | 383 | 4 365 |  |
 | Four or more storeys | 7 278 | 2 946 | 4 641 | 144 | 1 914 | - | 434 | 328 | 17 685 |  |
 | Total | 8 991 | 4 142 | 7 059 | 484 | 2 610 | 37 | 469 | 737 | 24 529 |  |
| Total new other residential building | 14 846 | 8 647 | 12 517 | 2 153 | 5 374 | 307 | 693 | 980 | 45 517 |  |
| Other |  |  |  |  |  |  |  |  |  |  |
 | Alterations and additions to residential building | 136 | 163 | 64 | 5 | 119 | 10 | 5 | - | 502 |  |
 | Conversion | 215 | 137 | 16 | 21 | 71 | 24 | 2 | - | 486 |  |
 | Non-residential building | 105 | 160 | 19 | 16 | 35 | 17 | 3 | 2 | 357 |  |
| Total building | 31 190 | 37 919 | 41 335 | 10 785 | 25 093 | 2 866 | 1 465 | 2 247 | 152 900 |  |
|  |
| - nil or rounded to zero (including null cells) |
SUMMARY COMMENT
Of the 152,900 dwelling units approved in Australia in 2006-07, 106,038 (69.4%) were new houses. Although new houses accounted for over 50% of approved dwellings units in each of the States and Territories the mix of dwelling types varied significantly across the States and Territories. New houses accounted for over 75% of all dwelling units in Victoria (76.0%), South Australia (79.6%), Western Australia (77.7%) and Tasmania (87.5%).
DWELLINGS APPROVED, States and territories
- By type of dwelling
- 2006-07

 Print Page
 Print All