Wheat production decreased by 24% from the previous year to 22.9 million tonnes nationally. This decrease was predominantly due to dry seasonal conditions. The area planted to wheat was down by 7% to 13.0 million hectares nationally.
Canola production reported another record year with an increase of 21% to 4.1 million tonnes. The largest increases in production were reported in New South Wales and Victoria. The area of canola planted for the 2012-13 crop increased by 33% from 2011-12 to 3.3 million hectares. The largest increases in area were in New South Wales and Western Australia. Canola yields were slightly lower in 2012-13 (down 9% to 1.3 tonnes per hectare).
Barley production fell 9% to 7.5 million tonnes due to dry seasonal conditions, particularly in the main barley growing state of Western Australia where most cropping regions experienced below average rainfall. The total area planted to barley fell by 2% to 3.6 million hectares. Yields were also lower, reflecting the dry conditions.
Sugar cane production rose 5% to 27.1 million tonnes despite a number of Queensland regions reporting damage to new plantings in early 2013. The area of sugar cane planted fell by 3% to 329,000 hectares, however yields rose by 8% from the previous year to 82 tonnes per hectare.
Cotton production fell by 8% to 894,000 tonnes in 2012-13. However, favourable conditions and water availability resulted in above average yields (up 25% on last year).
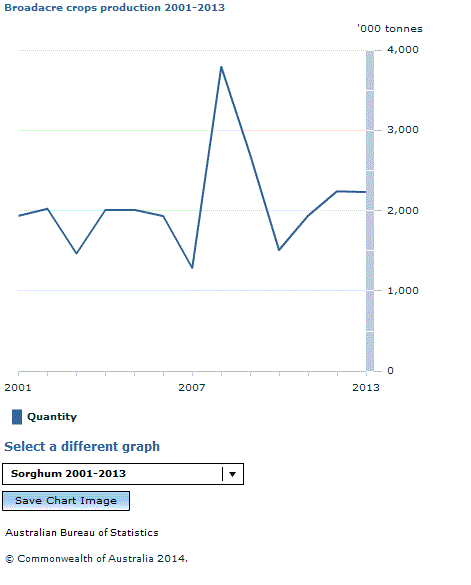
BROADACRE CROPS, Australia, year ended 30 June 2013
 Quality Declaration
  Print Page
 Print All