MAIN CONTRIBUTORS TO CHANGE
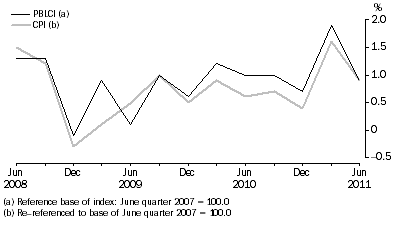
The PBLCI rose 0.9% for the June quarter 2011. Food (+1.4%) made the greatest contribution to the quarterly rise primarily due to increases in fruit prices largely due to shortages as a result of Cyclone Yasi in February 2011. Increases were also recorded in transportation (+1.7%) primarily due to automotive fuel and household contents and services (+1.2%) due to rises in furniture.
The only offset was provided by recreation (-0.3%) primarily due to falls in audio, visual and computing equipment and domestic holiday travel and accommodation.
The PBLCI (+0.9%) and the CPI (+0.9%) recorded the same movement in the June quarter 2011.
The PBLCI rose 4.5% through the year to the June quarter 2011 mainly due to increases in food (+6.7%) and housing (+5.7%). The major offsets were household contents and services (-0.2%) and recreation (-0.2%). The PBLCI showed a larger rise compared to the CPI (+3.6%) through the year to the June quarter 2011. Mortgage interest charges recorded a significant increase through the year to the June quarter 2011. For conceptual reasons this is not included in the CPI.
GRAPHS
Pensioner and Beneficiary Living Cost Index and CPI, All groups
- Percentage change from previous quarter
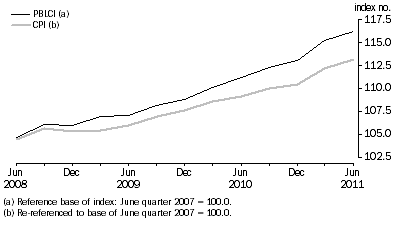
Comparison of PBLCI and CPI Indexes
Comparison of PBLCI and selected Analytical Living Cost Indexes
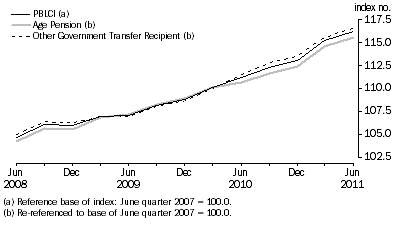
Table 1: Pensioner and Beneficiary Living Cost Index, All Groups, Weighted average of eight capital cities - index numbers, percentage change and points change |
|
 | | | Percentage change | Points change |
| Quarters | Index Numbers(a) | From previous quarter | From corresponding quarter of previous year | From previous quarter | From corresponding quarter of previous year |
|
| 2008 | | | | | |
| December | 106.0 | -0.1 | 4.2 | -0.1 | 4.3 |
| 2009 | | | | | |
| March | 107.0 | 0.9 | 3.5 | 1.0 | 3.6 |
| June | 107.1 | 0.1 | 2.3 | 0.1 | 2.4 |
| September | 108.2 | 1.0 | r2.0 | 1.1 | 2.1 |
| December | 108.8 | 0.6 | r2.6 | 0.6 | 2.8 |
| 2010 | | | | | |
| March | 110.1 | 1.2 | 2.9 | 1.3 | 3.1 |
| June | 111.2 | 1.0 | 3.8 | 1.1 | 4.1 |
| September | 112.3 | 1.0 | 3.8 | 1.1 | 4.1 |
| December | 113.1 | 0.7 | 4.0 | 0.8 | 4.3 |
| 2011 | | | | | |
| March | 115.2 | 1.9 | 4.6 | 2.1 | 5.1 |
| June | 116.2 | 0.9 | 4.5 | 1.0 | 5.0 |
|
| (a) Reference base of index: June quarter 2007 = 100.0 |
| r revised | | | | | |
Table 2: Percentage change in analytical living cost indexes, PBLCI and CPI, by commodity group - March Quarter 2011 to June Quarter 2011 |
|
| Commodity group | Age pensioner ALCI(a) | Other government transfer recipient ALCI(a) | PBLCI | CPI(b) |
|
| Food | 1.7 | 1.1 | 1.4 | 1.4 |
| Alcohol and tobacco | 0.6 | 1.0 | 0.8 | 0.7 |
| Clothing and footwear | 1.8 | 2.3 | 2.1 | 2.5 |
| Housing(c) | -0.2 | 0.2 | 0.0 | 0.4 |
| Household contents and services | 1.0 | 1.2 | 1.2 | 1.5 |
| Health | 1.8 | 1.2 | 1.6 | 2.0 |
| Transportation | 1.6 | 1.8 | 1.7 | 1.2 |
| Communication | 0.6 | 0.4 | 0.5 | 0.4 |
| Recreation | -0.3 | -0.2 | -0.3 | -0.6 |
| Education | 0.1 | 0.0 | 0.0 | 0.0 |
| Financial and insurance services(d) | 1.4 | 1.2 | 1.3 | 1.6 |
| All groups | 0.9 | 0.9 | 0.9 | 0.9 |
|
| (a) As published in Analytical Living Cost Indexes for Selected Australian Household Types (cat. no. 6463.0) |
| (b) As published in Consumer Price Index, Australia (cat. no. 6401.0) |
| (c) House purchases are included in the CPI but excluded from the population subgroup indexes. |
| (d) Includes interest charges and general insurance, except for the CPI. Interest charges are excluded from the CPI and general insurance is calculated on a different basis. |
Table 3: Points contribution to quarterly change, index points - March Quarter 2011 to June Quarter 2011 |
|
| Commodity group | Age pensioner ALCI(a) | Other government transfer recipient ALCI(a) | PBLCI(b) | CPI(a) |
|
| Food | 0.43 | 0.26 | 0.32 | 0.25 |
| Alcohol and tobacco | 0.06 | 0.14 | 0.10 | 0.06 |
| Clothing and footwear | 0.08 | 0.10 | 0.09 | 0.08 |
| Housing(c) | -0.07 | 0.04 | 0.00 | 0.09 |
| Household contents and services | 0.09 | 0.13 | 0.11 | 0.13 |
| Health | 0.16 | 0.05 | 0.09 | 0.11 |
| Transportation | 0.19 | 0.22 | 0.20 | 0.17 |
| Communication | 0.02 | 0.02 | 0.02 | 0.01 |
| Recreation | -0.04 | -0.02 | -0.03 | -0.07 |
| Education | 0.00 | -0.01 | 0.00 | 0.00 |
| Financial and insurance services(d) | 0.09 | 0.10 | 0.09 | 0.15 |
| All groups | 1.0 | 1.0 | 1.0 | 1.0 |
|
| (a) Re-referenced to base of June quarter 2007 = 100.0 |
| (b) Reference base of index: June quarter 2007 = 100.0 |
| (c) House purchases are included in the CPI but excluded from the population subgroup indexes. |
| (d) Includes interest charges and general insurance, except for the CPI. Interest charges are excluded from the CPI and general insurance is calculated on a different basis. |
Table 4: Contribution to total index, by commodity group, index points - March Quarter 2011 to June Quarter 2011 |
|
| Age pensioner ALCI(a) | Other government transfer recipient ALCI(a) | PBLCI(b) | CPI(a) |
| Commodity group | Mar Qtr 2011 | Jun Qtr 2011 | Mar Qtr 2011 | Jun Qtr 2011 | Mar Qtr 2011 | Jun Qtr 2011 | Mar Qtr 2011 | Jun Qtr 2011 |
|
| Food | 25.31 | 25.74 | 22.58 | 22.84 | 23.74 | 24.06 | 18.60 | 18.85 |
| Alcohol and tobacco | 8.86 | 8.92 | 13.23 | 13.37 | 11.40 | 11.50 | 8.55 | 8.61 |
| Clothing and footwear | 4.56 | 4.64 | 4.29 | 4.39 | 4.40 | 4.49 | 3.55 | 3.63 |
| Housing(c) | 22.03 | 21.96 | 25.09 | 25.13 | 23.80 | 23.80 | 24.26 | 24.35 |
| Household contents and services | 11.20 | 11.29 | 10.21 | 10.34 | 10.63 | 10.74 | 9.43 | 9.56 |
| Health | 8.67 | 8.83 | 3.74 | 3.79 | 5.82 | 5.91 | 5.69 | 5.80 |
| Transportation | 12.50 | 12.69 | 12.09 | 12.31 | 12.27 | 12.47 | 14.13 | 14.30 |
| Communication | 3.73 | 3.75 | 4.35 | 4.37 | 4.09 | 4.11 | 3.17 | 3.18 |
| Recreation | 11.25 | 11.21 | 9.78 | 9.76 | 10.40 | 10.37 | 11.38 | 11.31 |
| Education | 0.20 | 0.20 | 2.28 | 2.27 | 1.40 | 1.40 | 3.48 | 3.48 |
| Financial and insurance services(d) | 6.28 | 6.37 | 7.95 | 8.05 | 7.25 | 7.34 | 9.96 | 10.11 |
| All groups | 114.6 | 115.6 | 115.6 | 116.6 | 115.2 | 116.2 | 112.2 | 113.2 |
|
| (a) Re-referenced to base of June quarter 2007 = 100.0 |
| (b) Reference base of index: June quarter 2007 = 100.0 |
| (c) House purchases are included in the CPI but excluded from the population subgroup indexes. |
| (d) Includes interest charges and general insurance, except for the CPI. Interest charges are excluded from the CPI and general insurance is calculated on a different basis. |
Table 5: Percentage change in analytical living cost indexes, PBLCI and CPI, Commodity group - June Quarter 2010 to June Quarter 2011 |
|
| Commodity group | Age pensioner ALCI(a) | Other government transfer recipient ALCI(a) | PBLCI | CPI(b) |
|
| Food | 7.6 | 6.1 | 6.7 | 6.1 |
| Alcohol and tobacco | 5.5 | 8.2 | 7.3 | 5.6 |
| Clothing and footwear | 0.5 | 0.7 | 0.6 | 1.1 |
| Housing(c) | 6.1 | 5.5 | 5.7 | 4.6 |
| Household contents and services | -0.3 | -0.2 | -0.2 | 0.1 |
| Health | 4.0 | 3.5 | 3.9 | 4.0 |
| Transportation | 4.5 | 5.2 | 5.0 | 3.5 |
| Communication | 0.8 | 0.3 | 0.5 | 0.4 |
| Recreation | 0.2 | -0.5 | -0.2 | -0.3 |
| Education | 5.8 | 5.5 | 5.6 | 5.9 |
| Financial and insurance services(d) | 7.1 | 9.1 | 8.3 | 4.2 |
| All groups | 4.4 | 4.6 | 4.5 | 3.6 |
|
| (a) As published in Analytical Living Cost Indexes for Selected Australian Household Types (cat. no. 6463.0) |
| (b) As published in Consumer Price Index, Australia (cat. no. 6401.0) |
| (c) House purchases are included in the CPI but excluded from the population subgroup indexes. |
| (d) Includes interest charges and general insurance, except for the CPI. Interest charges are excluded from the CPI and general insurance is calculated on a different basis. |
Table 6: Points contribution to annual change, index points - June Quarter 2010 to June Quarter 2011 |
|
| Commodity group | Age pensioner ALCI(a) | Other government transfer recipient ALCI(a) | PBLCI(b) | CPI(a) |
|
| Food | 1.83 | 1.30 | 1.52 | 1.09 |
| Alcohol and tobacco | 0.46 | 1.01 | 0.78 | 0.46 |
| Clothing and footwear | 0.02 | 0.03 | 0.02 | 0.04 |
| Housing(c) | 1.25 | 1.32 | 1.29 | 1.07 |
| Household contents and services | -0.03 | -0.02 | -0.03 | 0.01 |
| Health | 0.34 | 0.13 | 0.22 | 0.22 |
| Transportation | 0.55 | 0.61 | 0.58 | 0.49 |
| Communication | 0.03 | 0.02 | 0.02 | 0.01 |
| Recreation | 0.03 | -0.06 | -0.02 | -0.04 |
| Education | 0.02 | 0.12 | 0.08 | 0.20 |
| Financial and insurance services(d) | 0.42 | 0.67 | 0.56 | 0.41 |
| All groups | 4.9 | 5.1 | 5.1 | 4.0 |
|
| (a) Re-referenced to base of June quarter 2007 = 100.0 |
| (b) Reference base of index: June quarter 2007 = 100.0 |
| (c) House purchases are included in the CPI but excluded from the population subgroup indexes |
| (d) Includes interest charges and general insurance, except for the CPI. Interest charges are excluded from the CPI and general insurance is calculated on a different basis. |
Table 7: Contribution to total index, Commodity group, index points - June Quarter 2010 to June Quarter 2011 |
|
| Age pensioner ALCI(a) | Other government transfer recipient ALCI(a) | PBLCI(b) | CPI(a) |
| Commodity group | Jun Qtr 2010 | Jun Qtr 2011 | Jun Qtr 2010 | Jun Qtr 2011 | Jun Qtr 2010 | Jun Qtr 2011 | Jun Qtr 2010 | Jun Qtr 2011 |
|
| Food | 23.91 | 25.74 | 21.54 | 22.84 | 22.54 | 24.06 | 17.76 | 18.85 |
| Alcohol and tobacco | 8.46 | 8.92 | 12.36 | 13.37 | 10.72 | 11.50 | 8.15 | 8.61 |
| Clothing and footwear | 4.62 | 4.64 | 4.36 | 4.39 | 4.47 | 4.49 | 3.59 | 3.63 |
| Housing(c) | 20.71 | 21.96 | 23.81 | 25.13 | 22.51 | 23.80 | 23.28 | 24.35 |
| Household contents and services | 11.32 | 11.29 | 10.36 | 10.34 | 10.77 | 10.74 | 9.55 | 9.56 |
| Health | 8.49 | 8.83 | 3.66 | 3.79 | 5.69 | 5.91 | 5.58 | 5.80 |
| Transportation | 12.14 | 12.69 | 11.70 | 12.31 | 11.89 | 12.47 | 13.81 | 14.30 |
| Communication | 3.72 | 3.75 | 4.35 | 4.37 | 4.09 | 4.11 | 3.17 | 3.18 |
| Recreation | 11.18 | 11.21 | 9.82 | 9.76 | 10.39 | 10.37 | 11.35 | 11.31 |
| Education | 0.18 | 0.20 | 2.15 | 2.27 | 1.32 | 1.40 | 3.28 | 3.48 |
| Financial and insurance services(d) | 5.95 | 6.37 | 7.38 | 8.05 | 6.78 | 7.34 | 9.70 | 10.11 |
| All groups | 110.7 | 115.6 | 111.5 | 116.6 | 111.2 | 116.2 | 109.2 | 113.2 |
|
| (a) Re-referenced to base of June quarter 2007 = 100.0 |
| (b) Reference base of index: June quarter 2007 = 100.0 |
| (c) House purchases are included in the CPI but excluded from the population subgroup indexes. |
| (d) Includes interest charges and general insurance, except for the CPI. Interest charges are excluded from the CPI and general insurance is calculated on a different basis. |
 Quality Declaration
  Print Page
 Print All