SUMMARY OF FINDINGS
OVERVIEW
There were 10,530,000 employed people aged 15 years and over in September 2007. Of these:
- 9,912,000 (94%) were fully employed
- 618,100 (6%) were not fully employed
- 518,300 (5%) were underemployed workers, of these:
- 472,200 usually worked part-time but would prefer more hours and were available to start work with more hours either in the reference week, or in the four weeks subsequent to the interview
- 46,200 usually worked full-time but worked part-time hours in the reference week due to economic reasons (being stood down, on short-time, or having insufficient work).
LABOUR FORCE UNDERUTILISATION
Labour underutilisation rates (a), September 2000 to September 2007
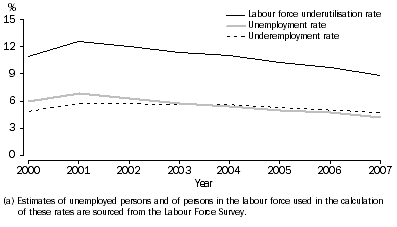
Underemployed workers are an important component of underultilised labour resources in the economy, capturing a dimension of such resources not available from the unemployment rate alone. In September 2007 the underemployment rate (underemployed workers as a percentage of the total labour force) was 4.7%. When this is combined with the unemployment rate for the same period (4.2%), the result is the labour force underutilisation rate (8.9%). This provides a broader indication of the proportion of the population affected by labour underutilisation. The labour force underutilisation rate has continued to decrease from 12.6% in September 2001 to 8.9% in September 2007.
PART-TIME WORKERS WHO WOULD PREFER MORE HOURS
In September 2007, there were 2,975,600 part-time workers (2,123,800 women and 851,800 men). There were 571,900 (19%) part-time workers who would prefer to work more hours, consisting of 368,900 women and 203,000 men.
Of the part-time workers who would prefer more hours:
- 33% were aged 15-24 years
- 57% would prefer to work full-time (72% of men and 50% of women)
- 472,200 were available for work with more hours
- 56% of these were looking for work with more hours
- 99,700 were not available for work with more hours
- 13% of these were looking for work with more hours.
UNDEREMPLOYED PART-TIME WORKERS
Underemployed part-time workers are people who usually work less than 35 hours a week, would prefer to work more hours and are available to start work with more hours. These people comprise the majority (91%) of all underemployed workers. In September 2007 there were 472,200 underemployed part-time workers. Of the underemployed part-time workers:
- 64% were women
- 21% were aged 35-44 years
- 17% were aged 15-19 years
- 24% usually work 21-29 hours each week
- 9% usually work 1-5 hours each week
- 26% reported they would move intrastate if offered a suitable job
- 18% reported they would move interstate if offered a suitable job.
Underemployed part-time workers as a proportion of part-time workers, Age by sex
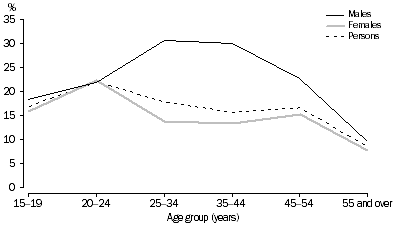
Part-time workers aged 20-24 years had the highest incidence of underemployment, with 22% of part-time workers in this age group underemployed. The proportion of part-time workers who were underemployed generally decreased with age.
While there were more women underemployed part-time workers than men, the incidence of underemployment for part-time workers was higher for men (20%) than women (14%) and this was the case in almost all age groups. The largest percentage point difference was for those aged 25-34 years and 35-44 years. In these two age groups, just under one-third (31% and 30%, respectively) of male part-time workers were underemployed, compared to 14% and 13% for women.
Underemployed part-time workers, Whether would move interstate/intrastate if offered a suitable job - Sex by age |
|  |
| Whether would move interstate | Whether would move intrastate | | |
| Would
move
interstate | Would
not move
interstate | Might/did
not know | Would
move
intrastate | Would
not move
intrastate | Might/did
not know | Total | |
| Age group (years) | % | % | % | % | % | % | '000 | |
Males | |
| |
| 15-34 | 22.4 | 66.6 | 10.9 | 33.2 | 51.8 | 15.0 | 102.1 | |
| 35-54 | 21.5 | 65.6 | 12.9 | 32.4 | 56.7 | *10.8 | 49.2 | |
| 55 and over | *13.7 | 75.7 | *10.6 | *19.8 | 59.5 | *20.8 | 20.6 | |
| Total | 21.1 | 67.4 | 11.5 | 31.4 | 54.1 | 14.5 | 171.8 | |
Females | |
| |
| 15-34 | 21.2 | 70.3 | 8.5 | 28.7 | 59.1 | 12.2 | 135.4 | |
| 35-54 | 14.0 | 79.2 | 6.7 | 18.6 | 69.1 | 12.3 | 139.3 | |
| 55 and over | *8.8 | 88.6 | **2.7 | *10.9 | 82.3 | *6.8 | 25.7 | |
| Total | 16.8 | 76.0 | 7.2 | 22.5 | 65.7 | 11.8 | 300.3 | |
Persons | |
| |
| 15-34 | 21.7 | 68.7 | 9.5 | 30.7 | 55.9 | 13.4 | 237.4 | |
| 35-54 | 16.0 | 75.7 | 8.3 | 22.2 | 65.9 | 11.9 | 188.5 | |
| 55 and over | *10.9 | 82.8 | *6.2 | 14.8 | 72.2 | 13.0 | 46.3 | |
| Total | 18.4 | 72.9 | 8.7 | 25.7 | 61.5 | 12.8 | 472.2 | |
| |
| * estimate has a relative standard error of 25% to 50% and should be used with caution |
| ** estimate has a relative standard error greater than 50% and is considered too unreliable for general use |
Generally, more underemployed part-time workers reported that they would move intrastate (26%) than interstate (18%). Men were more likely than women to report that they would move interstate or intrastate if offered a suitable job.
For those aged 15-34 years there was little difference between men and women who reported they would move interstate if offered a suitable job (22% and 21% respectively). However, 22% of men aged 35-54 years reported they would move interstate if offered a suitable job compared to 14% of women in the same age group.
About one-third (31%) of men reported they would move intrastate if offered a suitable job compared to 23% of women. There were higher proportions of men who would move intrastate compared to women in all age groups. Some 32% of men aged 35-54 years would move intrastate compared to 19% of women.
There was a higher proportion of people who reported uncertainty about moving intrastate than interstate if offered a suitable job (13% of underemployed part-time workers might move or did not know if they would move intrastate compared to 9% for interstate).
Duration of current period of insufficient work
Older people generally had a longer period of duration of underemployment than younger people. For example, one fifth (21%) of 15-19 year old underemployed part-time workers had experienced insufficient work for one year or more. In contrast, 44% of those aged 45-54 years, and 48% of those aged 55 years and over had insufficient work for one year or more.
Underemployed part-time workers, Duration of current period of insufficient work by age
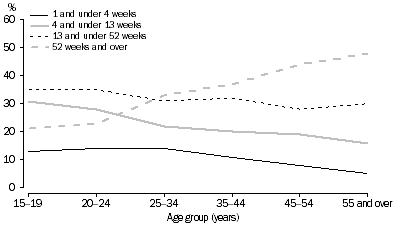
The median duration of the current period of insufficient work for underemployed part-time workers was 26 weeks. For those aged 15-19 years the median duration was 15 weeks and for those aged 55 years and over the median duration was 50 weeks.
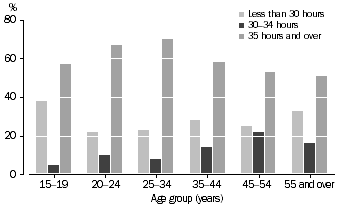
Preferred number of hours
The majority (60%) of underemployed part-time workers would prefer to work a total of 35 hours or more per week. For those aged 25-34 years, 70% preferred a total of 35 hours or more per week, while for those aged 15-19 years, 38% preferred a total of less than 30 hours per week.
Underemployed part-time workers, Preferred number of total hours by age
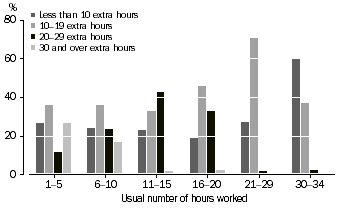
The number of extra hours preferred by part-time workers varied with the number of hours they usually worked. Generally, those usually working fewer hours wanted a greater number of extra hours. However, many of these did not want to work full-time hours. For example, 74% of those who usually worked 1-5 hours a week preferred less than 30 extra hours, and of those who worked 6-10 hours a week, 60% preferred less than 20 extra hours a week.
Underemployed part-time workers, Preferred number of extra hours by usual number of hours worked
The mean preferred number of extra hours per week for underemployed part-time workers was 14.4 hours. Men preferred to work an average of 16.0 extra hours each week compared with women who preferred to work an average extra 13.5 hours. The mean preferred number of extra hours was lowest for people aged 55 years and over (13.6 hours), and highest for those aged 15-19 years (15.4 hours).
Looking for work with more hours
Of the 472,200 underemployed part-time workers, 264,900 (56%) had looked for work with more hours at some time during the four weeks up to the end of the reference week. Of the 300,300 underemployed part-time women, just over half (54%) were looking for work with more hours. Whereas of the 171,800 underemployed part-time men, 61% were looking for work with more hours.
The most common step taken by underemployed part-time workers who had looked for work with more hours, was 'contacted prospective employers' (63%). This was followed by 'asked current employer for more work' (57%) and 'looked in newspapers' (54%). The largest percentage point differences between men and women were for 'contacted friends or relatives' (31% of men and 23% of women) and 'contacted prospective employers' (67% of men and 60% of women).
The main difficulty in finding work most commonly reported by underemployed part-time workers who had looked for work with more hours, was 'no vacancies in line of work' (20%). This was followed by 'other difficulties' (13%) and 'unsuitable hours', 'no vacancies at all' and 'no difficulties reported' (each around 9%). The largest percentage point difference between men and women was for 'no vacancies in line of work' (24% of men and 18% of women).
UNDEREMPLOYED FULL-TIME WORKERS
There were 7,554,500 full-time workers in September 2007, accounting for 72% of all employed people. About one in five (1,350,100 or 18%) worked less than 35 hours in the reference week in 2007. About 46,200 of these worked less than 35 hours in the reference week due to economic reasons. Of these:
- 76% were men
- 26% were aged 35-44 years.
 Quality Declaration
  Print Page
 Print All