SUMMARY OF FINDINGS
OVERVIEW
The 2006-07 Multi-Purpose Household Survey (MPHS) revealed that of the 15.4 million people aged 18 years and over, there were 6.3 million people who were not employed or who worked less than 16 hours. This group comprised people not in the labour force (5 million), the unemployed (370,200 people) and people working less than 16 hours (1 million).
Of those 6.3 million people, approximately 1.7 million (or 26%) indicated that they would like a job or to work more hours. This group comprised:
- 1,007,100 (or 61%) people who wanted a paid job but were not in the labour force
- 370,200 (or 22%) people who were unemployed
- 273,000 (or 17%) people who usually worked less than 16 hours per week but wanted to work more.
The remaining 4.7 million people (or 74%) did not want a job or did not want to work more hours, or were undecided.
PEOPLE WHO WANTED A JOB OR MORE HOURS
There were 1.7 million people who wanted a job or preferred more hours. Determining whether these people are available to work is important because those who are available have a greater potential to participate or increase their participation in the labour force than those who are not available.
Of the 1.7 million people who wanted a job or preferred more hours:
- 1.3 million people were available to start work within four weeks. Of these:
- 800,600 people were not looking for work or more hours
- 512,000 people were looking for work or more hours
- 337,700 people were not available to start work or work more hours within four weeks.
Women represented more than half (61%) of those who wanted a job or preferred more hours. This reflects the fact that more women are underemployed or not in the labour force than men.
Available but not looking for a job or work with more hours
Of the 1.3 million people who wanted a job or more hours and were available to start work within four weeks, an estimated 800,600 people (61%) indicated that they were not looking for a job or more hours. Most of this group were women (512,400 or 64%) and most were not in the labour force (695,600 or 87%).
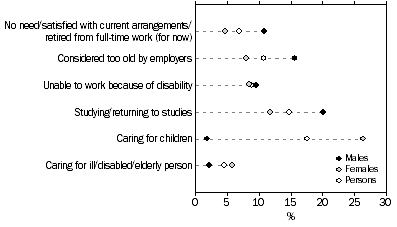
'Caring for children' was the most commonly reported main reason for not looking for work or more hours (140,600 people). Women comprised the majority of this group (96% or 135,400) and 62% of women who gave that response were in the 30-54 year age group. For those people who cited 'caring for children' as their main reason for not looking for work or more hours, 60,300 people (43%) reported that they 'preferred to look after children', while 29,900 people (21%) reported 'cost/too expensive'.
Another commonly reported main reason for not looking for work or more hours was 'studying/returning to studies' (118,100 people). Most people who reported this (81% or 96,100) were aged between 18 and 29 years, with 48% in this age group citing it as their main reason. This was the most common main reason for not looking reported by men (57,800 or 20%). Being considered too old by employers was another commonly reported main reason for not looking for work, or more hours (11% or 85,700). Of those people who gave this as their main reason, (91% or 77,600) were aged 55 years and over. More than one-quarter (28%) of people in this age group cited it as their main reason.
PERSONS AVAILABLE BUT NOT LOOKING FOR A JOB OR WORK WITH MORE HOURS, Selected main reason for not looking for work/more hours
Available and looking for a job or work with more hours
There were 512,000 people who wanted a job or more hours, were available, and were looking for work, of whom:
- Over half (56%) were women
- 370,200 were unemployed (72%)
- 117,800 usually worked less than 16 hours (23%)
- 24,000 were not in the labour force (5%) (these people are defined as not in the labour force rather than unemployed because they were not available to start work in the reference week, but were available to start within four weeks).
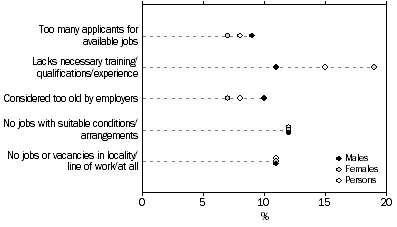
Overall, the main difficulty in finding a job reported by people who were available and looking for a job or work with more hours was 'lacks necessary training/qualifications/ experience' (77,700 people or 15%). More than two-thirds of those who reported this (69%) were women. 'No jobs with suitable conditions/arrangements' was another commonly reported difficulty (61,100 people or 12%), and 55% of those reporting this were women.
PERSONS AVAILABLE AND LOOKING FOR A JOB OR WORK WITH MORE HOURS, Selected main difficulty finding work/more hours
Not available to start a job or work with more hours
There were 337,700 people who wanted a job or more hours but who were not available to do so. Most of these (85%) were not in the labour force, while the remaining 15% comprised people who worked less than 16 hours. About two-thirds (216,000 or 64%) of those who wanted work or more hours but were not available were women.
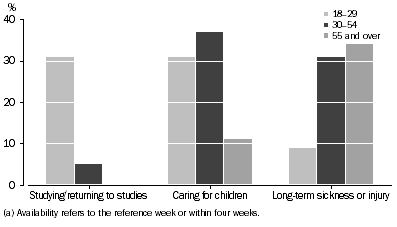
The reasons given by people for their unavailability varied by age, reflecting the fact that the reasons tend to change across the stages of the life cycle. The most common main reasons given by young people (those aged 18-29 years) for their unavailability were 'studying/returning to studies' (31%) and 'caring for children' (also 31%). For those aged 30-54 years who wanted to work (more) but were unavailable, 37% cited 'caring for children' as their main reason while a further 31% reported 'long-term sickness or injury' as their main reason. For older people (aged 55 years and over) 'long-term sickness/injury' was their most commonly reported main reason (34%).
PERSONS WHO WANTED A JOB OR WORK WITH MORE HOURS, BUT WERE NOT AVAILABLE(a), Age by selected main reason not available to start work/more hours
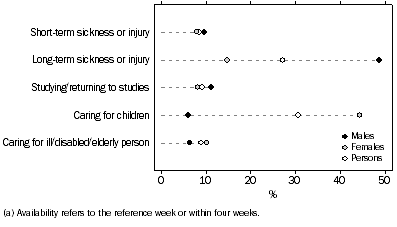
Men and women had different reasons for not being available to start work within four weeks. About 44% of the 216,000 women who wanted to work (more) but were unavailable reported that 'caring for children' was their main reason for their unavailability. One-third (73,700) of these women reported that their youngest child was aged less than four years. Other commonly reported main reasons given by women for not being available were 'long-term sickness or disability' (15% or 32,100), and 'caring for ill/disabled/elderly person' (10% or 22,100).
Of the 96,000 women who wanted a job or more hours but were not available due to caring for children, just under half (46% or 43,800) reported that they 'preferred to look after children' and 20% (or 19,500) reported 'childcare not available/childcare booked out/no childcare in locality'. Thirty percent of women who were not available to start work within four weeks reported that they would be available to start work within 6 months.
Of the 121,800 men who wanted a job or more hours but were not available, almost half reported that their main reason for unavailability was 'long-term sickness or disability' (49% or 59,300). In this group, 19% reported that they would be available to start work within 6 months. Other commonly reported main reasons given by men for not being available to start work within four weeks were 'studying/returning to studies' (13,500) and 'short-term sickness or injury' (11,700).
PERSONS WHO WANTED A JOB OR WORK WITH MORE HOURS, BUT WERE NOT AVAILABLE(a), Selected main reason not available to start work/more hours
Preferred weekly hours
Information about their preferred number of hours of work was collected from people not in the labour force who wanted a job and from people who usually worked less than 16 hours and wanted to work more.
Of the 1 million people not in the labour force who wanted a job, 75% reported that they would prefer to work part-time hours (61% of men and 82% of women). The average preferred number of hours was 21 (25 hours for men and 20 hours for women).
Similarly, for those who worked few hours, there were distinct differences in the hours preferences of men and women. Of the 100,200 men who wanted more hours, half preferred to work 35 hours or more and half preferred to work less than this. In contrast, three-quarters of women preferred part-time hours. Older people who usually worked less than 16 hours preferred to work less hours than their younger counterparts. For instance, the average preferred number of hours for people aged 55 years and over was 25 hours per week, compared with 29 hours for those aged 18-24 years.
PEOPLE WHO DID NOT WANT (MORE) WORK
Seventy-four percent (or 4.7 million) of those who were not employed or who worked less than 16 hours indicated that they did not want (more) work. This comprised:
- 4 million people (2,472,100 women and 1,504,900 men) who were not in the labour force
- 678,500 people (533,900 women and 144,600 men) who usually worked less than 16 hours.
The age structure of those who were not in the labour force and didn't want to work was quite different from those who worked less than 16 hours and didn't want more work. These different age structures reveal why the most common main reasons for not wanting (more) work are different between the two groups.
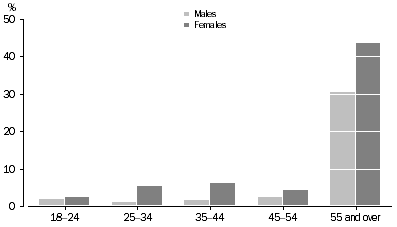
People who were not in the labour force and didn't want to work were older - just under three-quarters of them (74%) were aged 55 years and over. Women aged 55 years and over formed the largest single group, representing 44% of those who were not in the labour force and did not want to work, while men of that age represented 31%. Men in the younger age groups represented only a very small proportion of those not in the labour force who didn't want to work - men aged 18-44 years formed just 5% of this group. In contrast, women aged 18-44 years formed 14%.
PERSONS NOT IN THE LABOUR FORCE WHO DID NOT WANT TO WORK, Age and sex distribution
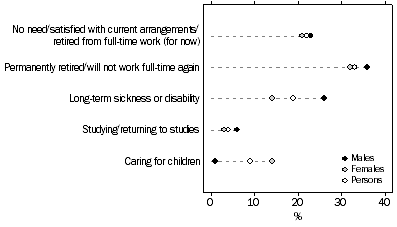
Of the 4 million people not in the labour force who did not want to work, the most commonly reported main reason for not wanting a job was 'permanently retired/will not work full time again' (34% or 1.3 million), followed by 'no need/satisfied with current arrangements/retired from full-time work (for now) (22% or 859,600), and 'long-term sickness or disability' (19% or 752,000).
'Long-term sickness or disability' was reported by 26% of men (or 395,700), with the highest proportion of these (58%) aged 30-54 years. Fourteen percent of women (or 345,300) indicated the main reason that they did not want to work was due to 'caring for children'. Most of these women (71%) were aged 30-54 years.
PERSONS NOT IN THE LABOUR FORCE WHO DID NOT WANT TO WORK, Selected main reason for not wanting work
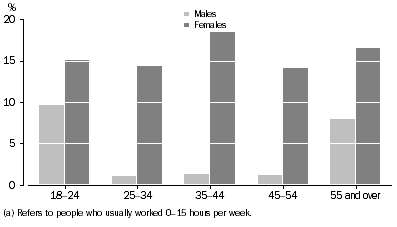
Men and women who usually worked less than 16 hours and didn't want more hours were relatively young - about 60% of them were aged between 18 and 44 years. Women made up more than three-quarters of those (79%) who worked less than 16 hours and who didn't want more work. Women aged 35-44 years formed the largest group (19%) of those working less than 16 hours and not wanting more work, followed by women aged 55 years and over (16%). Men aged 18-24 years formed the largest group (10%) of those men who worked less than 16 hours and did not want more work.
PERSONS WHO USUALLY WORKED LESS THAN 16 HOURS(a) AND DID NOT WANT TO WORK MORE, Age and sex distribution
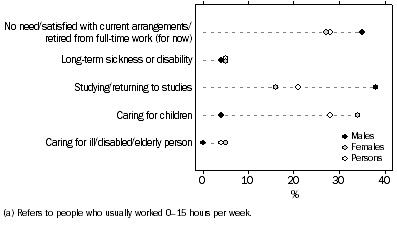
The most commonly reported main reason that women gave for not wanting more hours was 'caring for children' (34% or 183,600 women gave this response). Approximately 53% of women aged 30-54 years not wanting more hours (or 150,000) reported this as the main reason. This indicates that part-time work is particularly important for women who are raising children. More than one-quarter of women working less than 16 hours and who did not want to work more indicated that their main reason was 'no need/satisfied with current arrangements/retired from full-time work (for now)'. About 42% of these were aged 55 years and over.
There were 144,600 men who usually worked less than 16 hours. The most commonly reported main reason given by 38% of those men for not wanting more hours was 'studying/returning to studies' (with 93% of this group aged 18-29 years), followed by 'no need/satisfied with current arrangements/retired from full-time work (for now)' (35% or 50,300) (with 70% of this group aged 55 years and over).
PERSONS WHO USUALLY WORKED LESS THAN 16 HOURS(a) AND DID NOT WANT TO WORK MORE, Selected main reason for not wanting more hours
 Quality Declaration
  Print Page
 Print All