5249.0 - Australian National Accounts: Tourism Satellite Account, 2010-11  Quality Declaration
ARCHIVED ISSUE Released at 11:30 AM (CANBERRA TIME) 21/12/2011
Page tools:
 Print Page Print Page
 Print All Print All
| |||||||||||||||||||||||||||||||||||||||||||||||||||||||||||||||||||||||||||||||||||||||
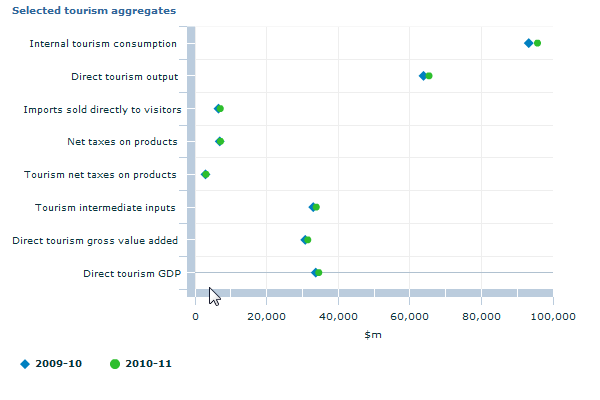
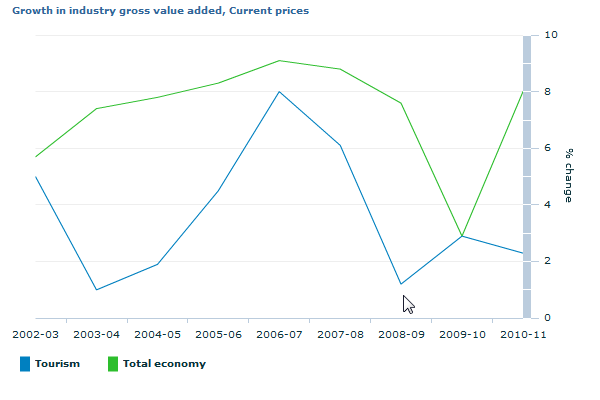
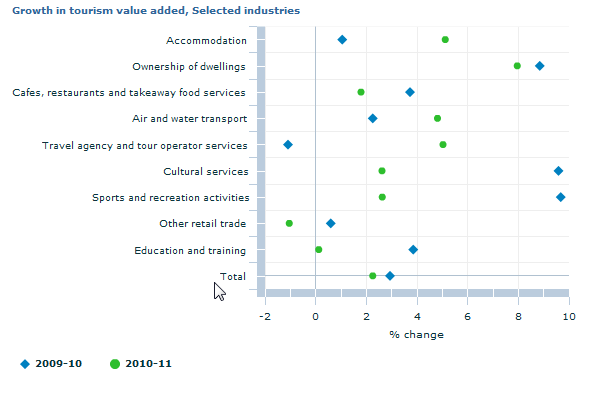
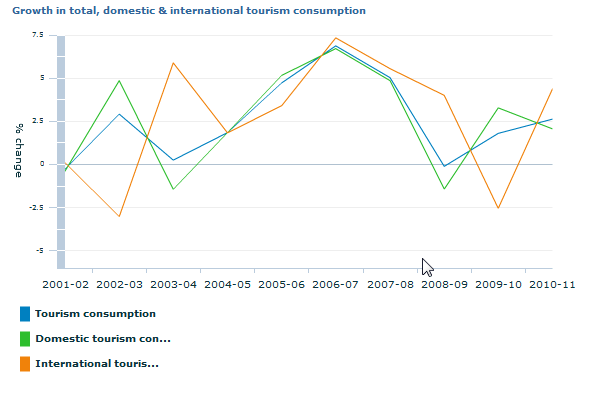
ANALYSIS OF RESULTS KEY RESULTS Tourism is not an industry or product in international statistical standards but it is commonly considered an industry by tourism researchers and economic analysts. In the Australian Tourism Satellite Account (TSA), the direct contribution of the tourism industry to the Australian economy has been measured using the demand generated by visitors and the supply of tourism products by domestic producers. Internal tourism consumption is the total value of goods and services consumed by both resident and non-resident visitors within Australia. It is measured in purchasers' prices (the price paid by the tourism consumer). In 2010-11 internal tourism consumption increased by 2.6% to $95,653m. The receipts of Australian producers of tourism goods and services exclude product taxes like the Goods and Services Tax (GST) and include subsidies (collectively known as net taxes). In 2010-11 net taxes on tourism products (includes net taxes on indirect tourism output) increased by 3.1% from $6,942m to $7,159m. Imported goods and services consumed by visitors are not part of domestic production by Australian industries. The cost to retailers of imported goods sold directly to visitors increased by 6.8% from $6,582m to $7,032m in 2010-11. Over the same period, internal tourism consumption at basic prices (internal tourism consumption at purchaser prices less imports and net taxes on tourism products) has increased by 2.2% to $81,462m. In the case of retail goods purchased by visitors, only the retail margin contributes to direct tourism output, value added and Gross Domestic Product (GDP). This is because it is deemed that only the retailer has a direct relationship with the visitor and is therefore part of the tourism industry. As a consequence the output, and consequently value added, attributed to other (than retail) industries is excluded from the value of direct tourism output. Direct tourism output is therefore equal to internal tourism consumption at basic prices less the cost to retailers of domestic goods sold directly to visitors. In 2010-11, direct tourism output has increased by 2.5% to $65,399m. When producing tourism goods and services Australian businesses use goods and services produced and supplied by other businesses. These are known as intermediate inputs and in 2010-11 increased by 2.7% from $33,025m to $33,904m. DIRECT TOURISM GROSS VALUE ADDED Industry gross value added measures the value of production exclusive of product taxes such as the GST. It is the preferred national accounts measure of the production of industries because it is free from distortions in prices caused by changes in tax rates or the introduction of new taxes. Direct tourism gross value added is calculated by subtracting tourism intermediate inputs from direct tourism output at basic prices. In 2010-11 direct tourism gross value added increased by 2.3% to $31,495m. Total industry gross value added increased by 8.0% to $1,299,285m, resulting in tourism share of value added falling 0.2 percentage points to 2.4%. When comparing tourism to other industries and the total economy it must be understood that tourism is not a distinct industry, rather it comprises a portion of the economic activity classified to ANZSIC industries in the core national accounts. DIRECT TOURISM GROSS DOMESTIC PRODUCT (DIRECT TOURISM GDP) Direct tourism GDP is calculated by adding tourism net taxes on products to direct tourism gross value added. In the case of goods, tourism net taxes on products will only include the net taxes attributable to retail trade activities, consistent with the derivation of other tourism supply measures. In 2010-11 direct tourism GDP increased by 2.5% to $34,595m in contrast to GDP for the Australian economy which grew by 8.3%. All the aggregates above are presented in current price terms, and so include the effects of price change as well as the volume of tourism activity. Volume estimates of tourism have not been compiled because of conceptual issues involved in deflating the supply side estimates. In the absence of volume estimates, the tourism share of industry GDP is presented. In 2010-11 the tourism share of GDP fell 0.1 percentage points to 2.5%. Tourism's share of GDP has declined steadily since a peak of 3.4% in 2000-01. While the peak in 2000-01 was heavily impacted by price increases in tourism services, resulting from the introduction of the GST and the volume impact of the Olympic Games, the overall trend of declining share has continued over a long period. COMPONENTS OF TOURISM INDUSTRY GROSS VALUE ADDED Accommodation, Air, water and other transport, Other retail trade and Cafes, restaurants and takeaway food services continue to be the most significant tourism industries. Combined, these industries account for 56.3% of direct tourism gross value added in 2010-11. Direct tourism gross value added increased by $693m (2.3%) in 2010-11 to $31,495m. The tourism related industries representing the largest contributors to the increase in tourism gross value added in this period were Accommodation (up $273m, 5.1%), Air and water transport (up $222m, 4.8%) and Ownership of dwellings (up $215m, 8.0%). The largest of the five negative contributors to direct tourism gross value added were All other industries (down $181m, -8.1%) and Other retail trade (down $40m, -1.0%). COMPONENTS OF TOURISM CONSUMPTION Internal tourism consumption increased by 2.6% to $95,653m in 2010-11. Domestic tourism consumption increased by 2.1% to $71,972m and international tourism consumption increased by 4.4% to $23,681m following a fall of 2.5% in 2009-10. In the period 2010-11, domestic tourism consumption represents 75.2% of total tourism consumption, whereas international consumption represents 24.8%. The contribution of international tourism consumption to total internal tourism consumption is at its second highest level ever (with data going back to 1997-98). Of the $71,972m increase in domestic tourism consumption in 2010-11, consumption by households increased by $1,196m (2.0%) and consumption by business and government increased by $263m (2.5%). The major contributors to the increase in domestic tourism consumption in this period were Long distance passenger transportation (up $277m, 2.7%); Imputed and actual rent on dwellings (up $270m, 9.1%); Accommodation services (up $246m, 3.5%); Shopping, gifts and souvenirs (up $198m, 2.0%); and Alcoholic beverages and other beverages (up $186m, 5.8%). At the same time, reduced levels of domestic tourism consumption were recorded for Other tourism goods and services (down $206m, -9.3%); Fuel (petrol, diesel) (down $33m, -0.5%); Repair and maintenance of motor vehicles (down $26m, -8.0%); Motor vehicles (down $17m, -1.0%); and Motor vehicle hire and lease (down $5m, -0.5%).
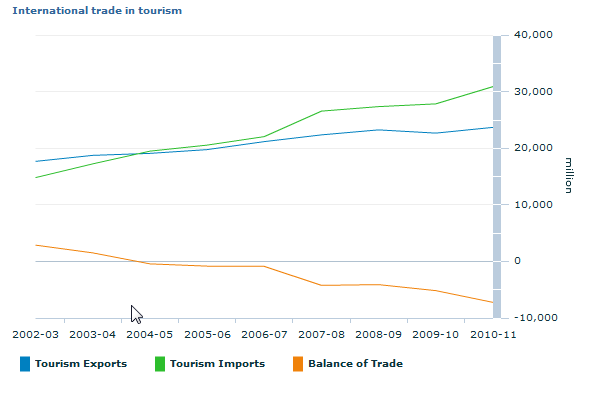
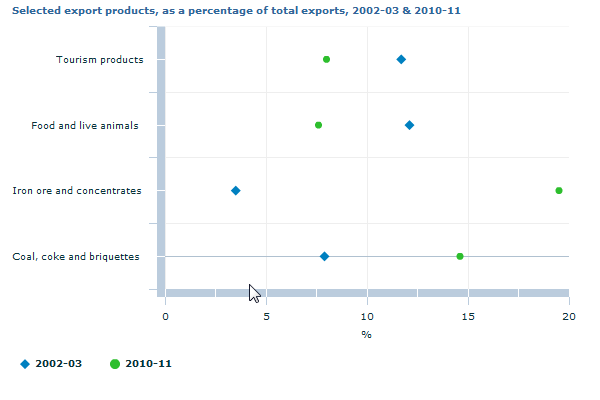
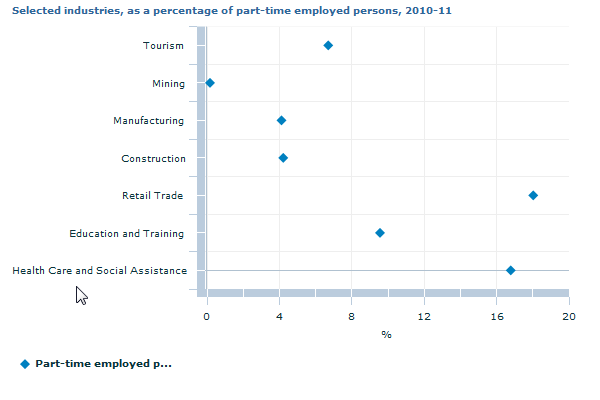
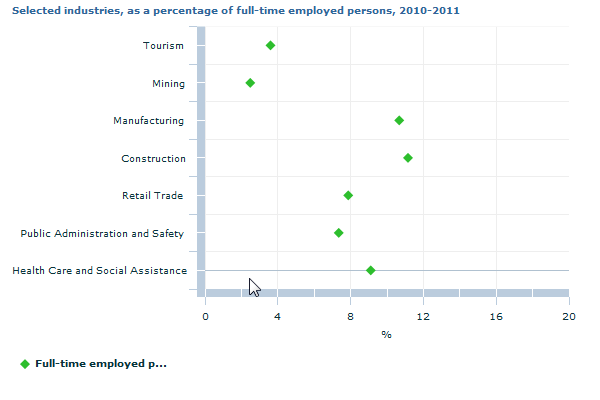
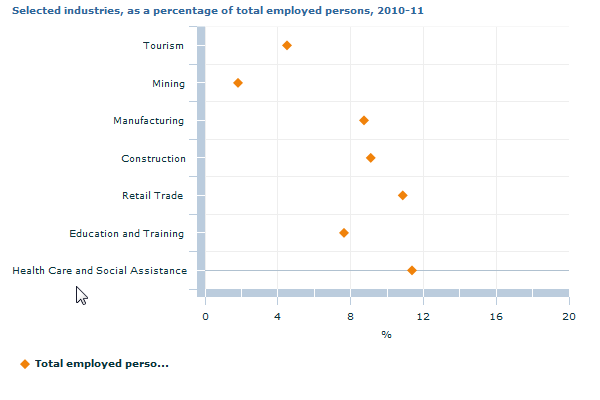
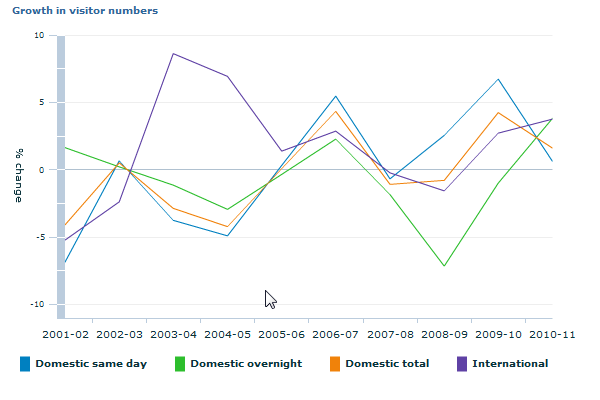
Major contributors to total tourism consumption continue to be Long distance passenger transportation, Takeaway and restaurant meals, Shopping (including gifts and souvenirs) and Accommodation services. Combined, these products contribute 55.5% of total tourism consumption in 2010-11 (up from 55.3% in 2009-10). This rise was mainly driven by increases in contribution to total tourism consumption of Accommodation services and Imputed and actual rent on dwellings. INTERNATIONAL TRADE IN TOURISM Tourism exports are domestically produced goods and services consumed by international visitors to Australia. Tourism imports are consumption of overseas produced goods and services by Australians on overseas trips. Since 2004-05 tourism imports have exceeded tourism exports, resulting in deficits in the tourism balance of trade (tourism exports less tourism imports). In 2010-11 the deficit totalled $7,220m. Despite the trade deficit, tourism does make an important contribution to Australia's total export earnings. Total tourism characteristic products compare favourably with some other Australian 'traditional' export products. Whilst the contribution of tourism to total exports has fallen from 11.7% in 2002-03 to 8.0% in 2010-11, in current price terms the value of these exports (international visitor consumption) has grown from $17,709m to $23,681m. In 2010-11 tourism made a slightly higher contribution to Australia's export earnings than food and live animal products, although it made a smaller contribution than key mining exports such as iron ore and concentrates and coal, coke and briquettes. These mining exports have experienced much higher growth rates over the period 2002-03 to 2010-11. TOURISM EMPLOYED PERSONS Tourism is an important source of employment in Australia, accounting for 4.5% of total employed persons in the economy. Tourism's share of total employment is greater than its share of gross value added (2.4%). This is because tourism tends to be more labour-intensive than, on average, other forms of economic activity. The tourism industry employed 513,700 persons in 2010-11, an increase of 13,500 (2.7%) on 2009-10. This compares with an increase of 3.0% in total employed persons in the Australian economy. Since 2001-02, the tourism share of total employment has decreased by 0.5 percentage points, although the number of tourism employed persons grew by 54,500 over this same period. This publication also presents a split of tourism employed persons into part-time and full-time workers for the first time since experimental estimates were released relating to the reference year 1997-98. Implementation of changes to the Australian and New Zealand Standard Industrial Classification 2006 (ANZSIC 2006) in the Labour Force Survey (ABS cat. no. 6202.0) resulted in sub-industry data (which can be directly mapped to the tourism characteristic and connected industries) being published at a sufficient level of detail and quality to enable tourism ratio derivation of these estimates in the Tourism Satellite Account. In 2010-11, 43.7% of total tourism employed persons were part-time. This compares with the economy wide proportion of part-time workers of 29.4%. This equates to tourism contributing 6.7% of total part-time employed persons in 2010-11. Only four other industries had a higher share of total part-time employed persons in 2010-11. In 2010-11, tourism had 289,300 full-time employed persons, which accounted for 56.3% of tourism employment. Tourism had a lower relative share of full-time employed persons (3.6%) than twelve other industries (out of a total of nineteen industries), although this share was higher than the Mining industry despite the latter contributing more to total industry gross value added and exports of goods and services. VISITOR NUMBERS The decrease in tourism consumption by same day domestic visitors in 2010-11 (down 3.2%) was driven by a decrease in average consumption by same day visitors (down 3.8%) and despite an increase in the number of same day visitors (up 0.6%). The increase in tourism consumption by overnight domestic visitors (up 3.7%) was the result of an increase in the number of visitors (up 3.8%) combined with a small decrease in per visitor consumption (down 0.1%). The increase in international tourism consumption in 2010-11 (up 4.4%) was the result of an increase in the number of visitors (up 3.8%) combined with an increase in per visitor consumption (up 0.6%). The overall increase in the number of international visitors to Australia was driven mainly by gains in the number of visitors from China (up 26.9%), New Zealand (up 5.3%) and Malaysia (up 13.8%). The number of Australians travelling overseas grew by 9.9% in 2010-11, with the growth driven by increased number of Australians visiting Indonesia, the United States of America and Thailand.
Document Selection These documents will be presented in a new window.
|
|||||||||||||||||||||||||||||||||||||||||||||||||||||||||||||||||||||||||||||||||||||||

