 Quality Declaration
Page tools:
 Print Page Print Page
 Print All Print All
| |||||||||||||||||||||||||||||||||||||||||||||||||||||||||||||||||||||||||||||||||||||||||||||||||||||||||||||||||||||||||||||||||||||||||||||||||||||||||||||||||||||||||||||||||||||||||||||||
FOCUS ON HUMANITARIAN MIGRANTS Humanitarian entrants in 2011-12 The protection of refugees and other displaced people in humanitarian need is a major global challenge. The Office of the United Nations High Commissioner for Refugees (UNHCR) estimates that there were 42.5 million forcibly displaced people worldwide at the end of 2011 (UNHCR, 2012). Australia is a leading resettlement country and ranks third among the top three resettlement countries, after the United States of America and Canada (UNHCR, 2011). The Australian Government’s Humanitarian Programme represents an important part of our contribution to the protection of refugees and others in humanitarian need along with the rest of the international community. The Humanitarian Programme has two components: resettlement for people offshore who have been determined to be refugees or in humanitarian need, and protection for those people who are already onshore who claim Australia’s protection and are found to be refugees (DIAC, 2012b). In 2011-12, a total of 13,759 visas were granted under the Australian Government's Humanitarian Programme. Of these, 44% were Refugee visas, 5.2% were Special Humanitarian Programme (SHP) visas and 51% were Protection visas and other visas granted onshore. Most were granted to persons born in South–East, Southern and Central Asia (52%), a further 28% to persons born in North Africa and the Middle East and a fifth to persons born in Sub–Saharan Africa (DIAC, 2012a). Graph 5: Humanitarian Migrants, Humanitarian Programme visa grants, By Financial year of visa grant and Visa type 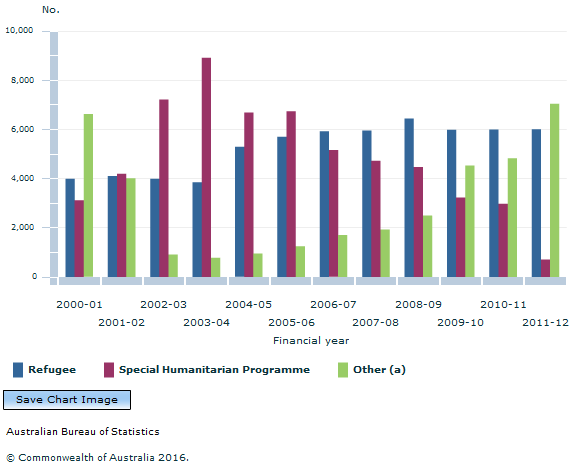 Footnote(s): (a) Includes "Special Assistance Category" and Onshore. Source(s): Historical migration statistics, Department of Immigration and Border Protection (DIBP) The size of the Humanitarian migrant population in Australia is quite small when compared with migrants from the Skill and Family streams. The 2011 Australian Census and Migrants Integrated Dataset shows that Humanitarian migrants represent only 11% of the migrant population and Graph 6 shows that they have a much younger age profile than Skill stream and Family stream migrants. Graph 6: Permanent Migrants, Proportion of permanent migrants of each visa stream, By Age group and Visa stream, 2011 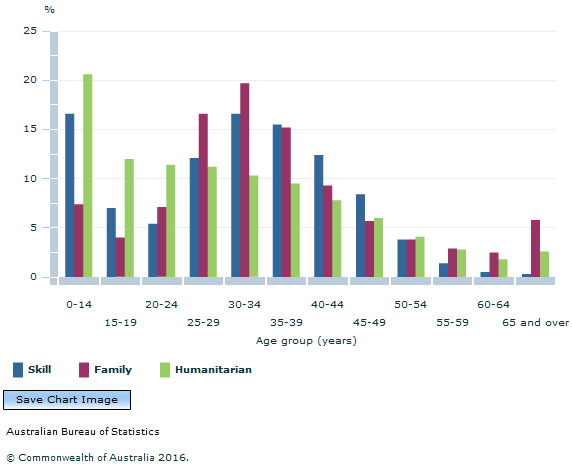 Source(s): Australian Census and Migrants Integrated Dataset (ACMID), 2011 How much personal income did Humanitarian migrants generate in 2011-12? In 2011-12, the Personal Income Tax and Migrants Integrated Dataset showed that Humanitarian entrants represented 4.8% of all migrant taxpayers, 15 years and over. Humanitarian migrant taxpayers reported almost $1.5 billion in Total income. This was an increase of 35% in real terms on 2010-11 (compared with an increase of 22% in the number of humanitarian migrants) and was the highest increase of all the visa streams. Table 2 shows the increases in the personal income of Humanitarian migrants from 2009-10 to 2011-12. Table 2: Humanitarian Migrant Taxpayers, Number of migrant taxpayers and Total income, By source of income, 2009-10 to 2011-12
Note: Income data for 2009-10 and 2010-11 has been adjusted by CPI. Source: Personal Income Tax and Migrants Integrated Dataset (PITMID), 2009-10, 2010-11 and 2011-12 What are the main countries that Humanitarian migrants come from? The financial characteristics of Humanitarian migrant taxpayers can vary considerably depending upon their country of birth. Just over 70% of Humanitarian taxpayers were born in just ten countries in 2011-12. Table 3 below shows Humanitarian migrants’ income in 2011-12 by the top ten countries of birth. Table 3: Humanitarian Migrant Taxpayers, Number of migrants, Total income and Median Total income, By selected Country of birth, 2011-12
(b) Includes Country of birth "Inadequately described", "Not stated" and "Born at sea". Source: Personal Income Tax and Migrants Integrated Dataset, 2011-12 In 2011-12, Humanitarian migrants reported $1,298 million in Employee income, $149 million in Business income, $14 million in Investment income and $3 million in Other income. Most Humanitarian taxpayers were from Sudan, which was the second highest country of birth from which Australia received Humanitarian migrants in 2011-12. Humanitarian migrants from Sierra Leone had the highest median income of all Humanitarian migrant taxpayers with $37,823. Graph 7B shows that the Sudanese taxpayers reported the highest proportion of Employee income with 18% ($233 million). They also reported 7.4% of Business income and 4.2% of Investment income. Humanitarian taxpayers born in Afghanistan showed a much greater propensity for business than other Humanitarian taxpayers. They reported 28% ($41 million) of Business income in 2011-12. Humanitarian taxpayers born in Iraq reported the highest proportion of Investment income in 2011-12 at 26%. Graph 7A: Humanitarian Migrant Taxpayers, Proportion of taxpayers in each income source, By Country of birth, 2011-12 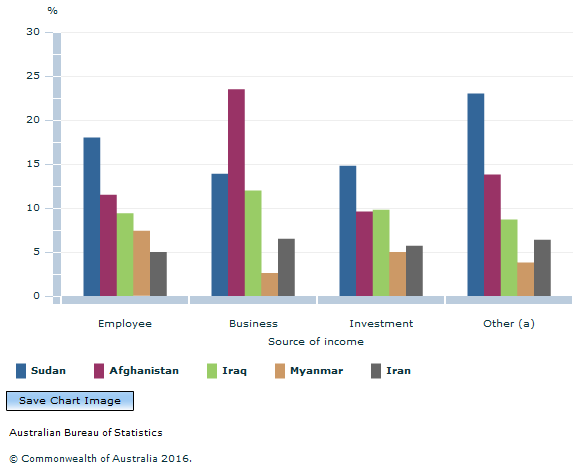 Footnote(s): (a) Includes Superannuation and annuities income. Source(s): Personal Income Tax and Migrants Integrated Dataset (PITMID), 2011-12 (cat. no. 3418.0) Graph 7B: Humanitarian Migrant Taxpayers, Proportion of total income source, By Country of birth, 2011-12 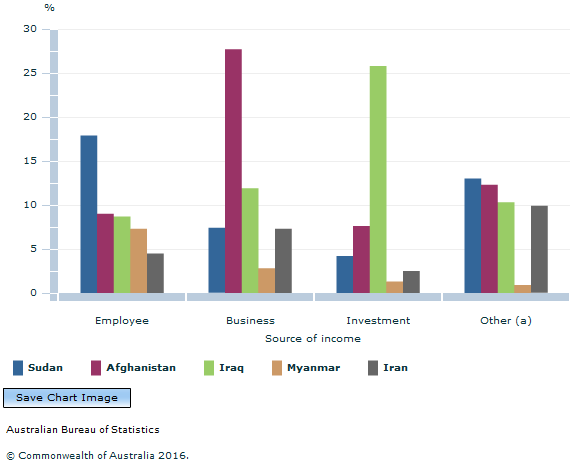 Footnote(s): (a) Includes Superannuation and annuities income. Source(s): Personal Income Tax and Migrants Integrated Dataset (PITMID), 2011-12 (cat. no. 3418.0) How much income did Humanitarian Employees earn? Humanitarian migrant taxpayers reported $1.3 billion in Employee income in 2011-12. The median Employee income of Humanitarian migrants was $27,150, well below the Australian taxpayer median Employee income of $43,405 in 2011-12. Across all Humanitarian migrants, female migrants generally had lower median Employee income than their male counterparts. However, there are a number of inter-related factors other than gender which are known to influence the level of earnings of males and females. Research has shown that differences in working arrangements, for example, part-time vs full-time, industry of employment and job history impacts the income males and females receive (ABS, 2014). Graph 8: Humanitarian Migrant Taxpayers, Median Employee income, By Age group and Sex, 2011-12 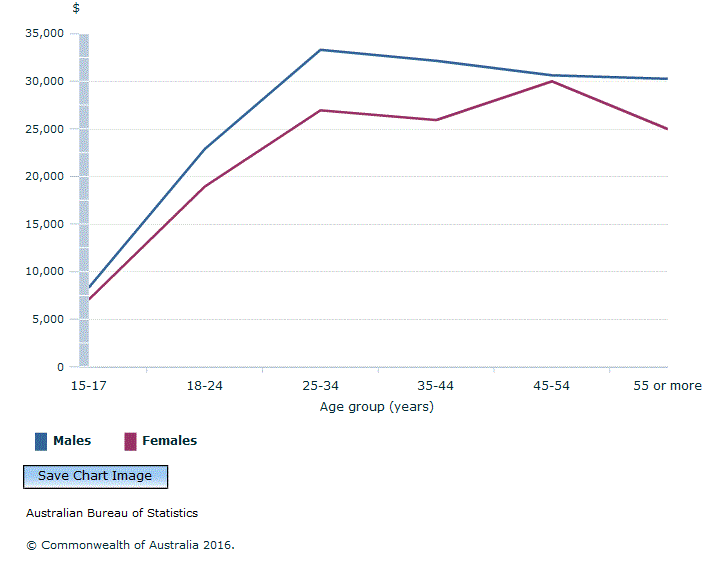 Source(s): Personal Income Tax and Migrants Integrated Dataset (PITMID), 2011-12 (cat. no. 3418.0) In 2011-12, the median employee income of migrants in the Humanitarian stream was much lower than migrants in the Skill and Family streams. The median Employee income of Humanitarian migrants peaks at $31,578 at around 25-34 years of age. For the older age groups it remained stable at around $30,000. By contrast, the median Employee income of Skill and Family stream migrants peaks at around 35-44 years of age before decreasing markedly for those aged over 50 years. Graph 9: Migrant Taxpayers, Median Employee income, By Age group (years) and Visa stream, 2011-12 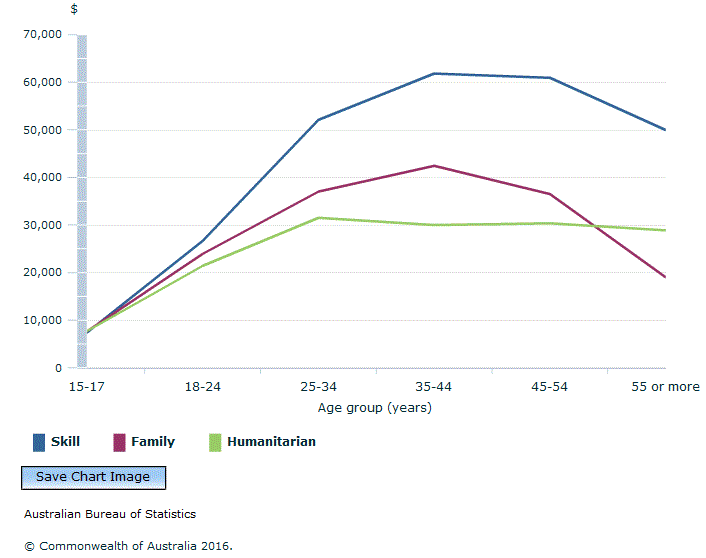 Source(s): Personal Income Tax and Migrants Integrated Dataset (PITMID), 2011-12 (cat. no. 3418.0) What are the main occupations of Humanitarian migrants? Graph 10 shows that the main occupation in 2011-12 for Humanitarian migrant taxpayers was Labourer. One-third of all such taxpayers reported working as a Labourer, and this was also the case in 2009-10 and 2010-11. Graph 10: Humanitarian Migrant Taxpayers, Proportion of migrant taxpayers reporting each occupation (a), By Occupation of main job and Financial year 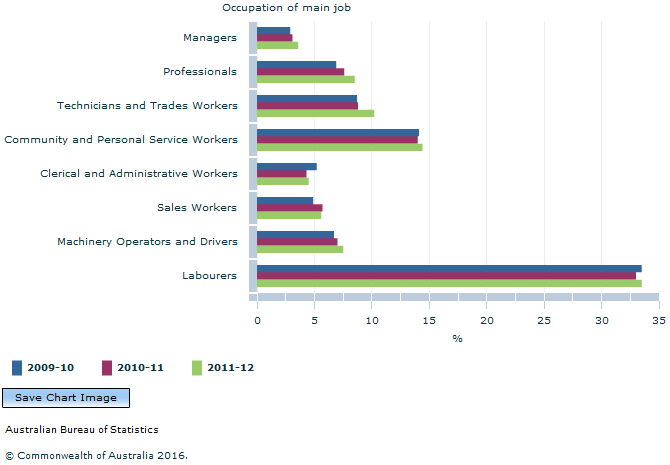 Footnote(s): (a) Includes Occupation "Inadequately described". Source(s): Personal Income Tax and Migrants Integrated Dataset (PITMID), 2009-10, 2010-11 and 2011-12 (cat. no. 3418.0) Graph 11 shows that the median Employee income for Humanitarian migrants working as labourers increased markedly in the first four years after arrival. The median income of males remained between $30,000 and $35,000 for those who had been in Australia at least three years. By comparison, median Employee income for female Humanitarian migrants working as labourers increased gradually over time, almost reaching parity with males after ten years. Graph 11: Humanitarian Migrant Taxpayers Working as Labourers, Median Employee income, By Period of residence in Australia and Sex, 2011-12 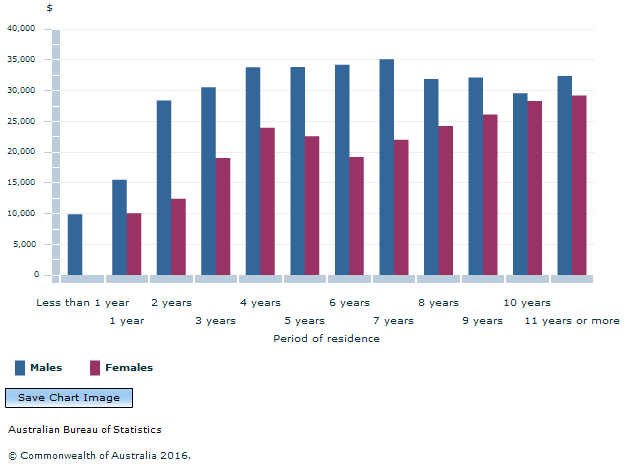 Source(s): Personal Income Tax and Migrants Integrated Dataset (PITMID), 2011-12 (cat. no. 3418.0) Humanitarian migrants appear to be transitioning in their employment and "working their way up” into more highly skilled occupations the longer they stay in Australia. Graph 12 shows that almost two-thirds of Humanitarian migrant taxpayers were in low skilled occupations in the first year after arrival. The proportion of Humanitarian migrants in each skill group becomes more equal as their length of stay in Australia increased. After 10 years of residency, around 30% of Humanitarian migrants were employed in highly skilled occupations. The proportion of Humanitarian migrants whose main occupation was highly skilled (i.e. Manager, Professional or Technicians and trades worker) increased from 19% in 2010-11 to 22% in 2011-12. Graph 12: Humanitarian Migrant Taxpayers, Proportion of migrant taxpayers reporting each occupation skill level (a), By Occupation skill level of main job and Period of residence in Australia, 2011-12 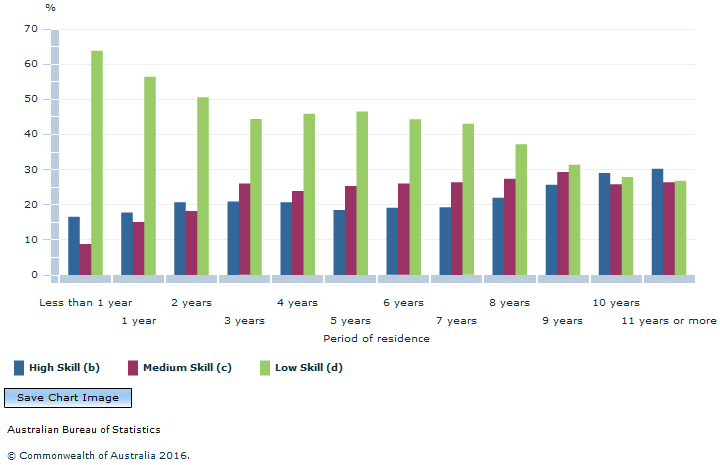 Footnote(s): (a) Includes Occupation "Inadequately described". (b) High skilled includes Managers, Professionals and Technicians and trades workers. (c) Medium skilled includes Community and personal service workers, Clerical and administrative workers and Sales workers. (d) Low skilled includes Machinery operators and drivers and Labourers. Source(s): Personal Income Tax and Migrants Integrated Dataset (PITMID), 2011-12 (cat. no. 3418.0) Humanitarian migrant taxpayers employed in Medium skilled jobs who had been in Australia at least five years experienced a small decline in their median Employee incomes. By comparison, Humanitarian migrants in low skilled occupations who had been in Australia for 4 or more years had consistently higher median Employee income than those employed in the medium skilled occupations. Graph 13: Humanitarian Migrant Taxpayers, Median employee income, By Occupation skill level of main job and Period of residence in Australia, 2011-12 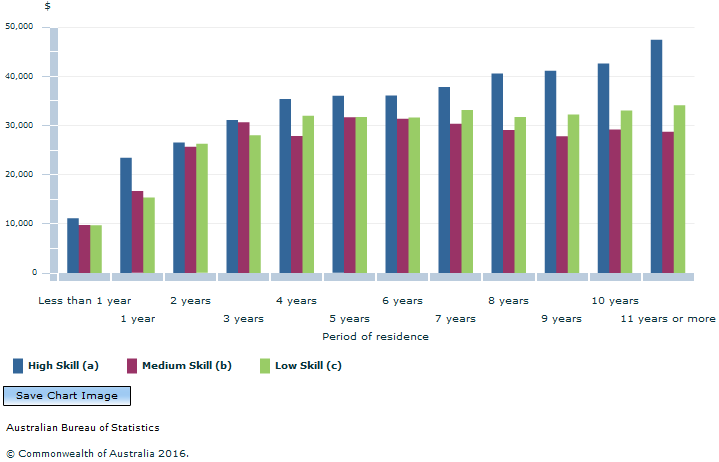 Footnote(s): (a) High skilled includes Managers, Professionals and Technicians and trades workers. (b) Medium skilled includes Community and personal service workers, Clerical and administrative workers and Sales workers.(c) Low skilled includes Machinery operators and drivers and Labourers. Source(s): Personal Income Tax and Migrants Integrated Dataset (PITMID), 2011-12 (cat. no. 3418.0) Humanitarian Migrant Business owners Humanitarian migrants are the most entrepreneurial. For the last three financial years they have had the highest median Business income, exceeding migrant taxpayers from all other visa streams. Table 4: Migrant Taxpayers, Median Own Unincorporated Business income, By Visa stream, 2009-10 to 2011-12
Note: Total income for 2009-10 and 2010-11 has been adjusted for CPI. Source: Personal Income Tax and Migrants Integrated Dataset, 2009-10, 2010-11 and 2011-12 Over two thirds (67%) of Humanitarian business owners were primary applicants. A primary applicant or main applicant is generally the person whose skills or proposed activities in Australia are assessed by the Department of Immigration and Border Protection (DIBP) as part of their visa application. Most were males aged between 29 and 40 years of age. By contrast, there were more female secondary applicants (e.g. spouse, dependent child, family member of a primary applicant) reporting Business income aged between 35 and 42 years of age than males. Graph 14: Humanitarian Migrant Taxpayers who Reported Income from their Own Unincorporated Business, Proportion of migrant taxpayers, By Applicant status and Sex, 2011-12 In 2011-12, Humanitarian migrant taxpayers reported $149 million in Business income. There was a large increase on 2010-11 in Humanitarian Business owners, in particular for Humanitarian migrants who arrived between 2003 and 2006. Humanitarian migrants tend to be quite entrepreneurial, especially after about 7 years of settlement. The proportion with Business income continues to steadily increase for those who arrived before 2005, reaching a high of almost 30% for those who arrived in 2000. Almost half of Humanitarian migrant Business income (49%) was from businesses in the Construction and Transport, postal and warehousing industries. Graph 15: Humanitarian Migrant Taxpayers, Proportion of Humanitarian migrant taxpayers who reported income from their own unincorporated business, By Year of arrival and Financial year 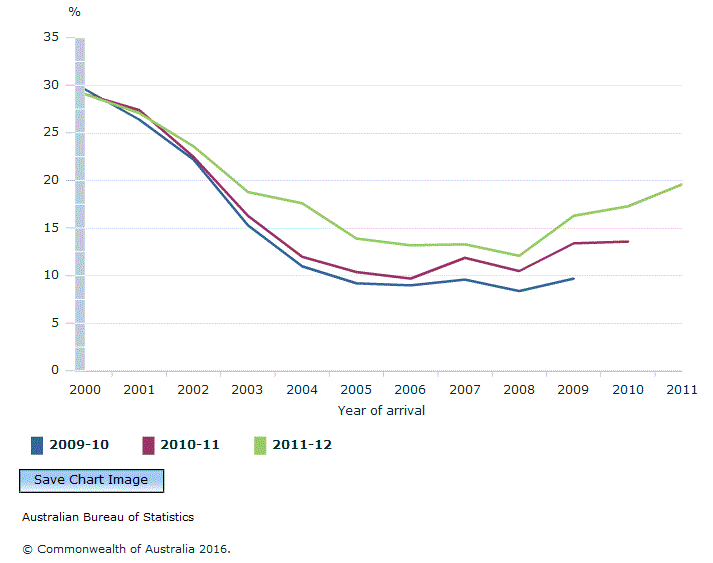 Source(s): Personal Income Tax and Migrants Integrated Dataset (PITMID), 2009-10, 2010-11 and 2011-12 (cat. no. 3418.0) Notes
References Australian Bureau of Statistics (ABS) (2014), Australian Labour Market Statistics, July 2014 (cat. no. 6105.0), Understanding Earnings in Australia Using ABS Statistics, Canberra. Viewed at<https://www.abs.gov.au/ausstats/abs@.nsf/Latestproducts/6105.0Feature%20Article55July%202014?opendocument&tabname=Summary∏no=6105.0&issue=July%202014νm=&view=> on 26/09/16 Department of Immigration and Border Protection (2012) Australian Migration Trends, 2011-12, DIBP, Canberra. Viewed at <https://www.border.gov.au/ReportsandPublications/Documents/statistics/australian-migration-trends-2011-12.pdf> on 26/09/16 Department of Immigration and Citizenship, 2012a, Australia’s offshore Humanitarian Programme: 2011-12, Canberra. Viewed at <https://www.border.gov.au/ReportsandPublications/Documents/statistics/australia_offshore_humanitarian_prog_2011-12.pdf> on 26/09/16 Department of Immigration and Citizenship (2012b) Annual Report, 2011-12, DIAC, Canberra. Viewed at <https://www.border.gov.au/ReportsandPublications/Documents/annual-reports/2011-12-diac-annual-report.pdf> on 26/09/16 United Nations High Commissioner for Refugees (UNHCR), 2011, UNHCR Global Trends 2010, Geneva. United Nations High Commissioner for Refugees (UNHCR), 2012, UNHCR Global Trends 2011, Geneva. Document Selection These documents will be presented in a new window.
|
|||||||||||||||||||||||||||||||||||||||||||||||||||||||||||||||||||||||||||||||||||||||||||||||||||||||||||||||||||||||||||||||||||||||||||||||||||||||||||||||||||||||||||||||||||||||||||||||
