JUNE KEY FIGURES
 | Population at end
Jun qtr 2006 | Change over
previous year | Change over
previous year | |
| PRELIMINARY DATA | '000 | '000 | % | |
| |
| New South Wales | 6 827.7 | 58.8 | 0.9 | |
| Victoria | 5 091.7 | 68.5 | 1.4 | |
| Queensland | 4 053.4 | 76.4 | 1.9 | |
| South Australia | 1 554.7 | 12.6 | 0.8 | |
| Western Australia | 2 050.9 | 39.9 | 2.0 | |
| Tasmania | 488.9 | 3.3 | 0.7 | |
| Northern Territory | 206.7 | 3.3 | 1.6 | |
| Australian Capital Territory | 328.8 | 3.0 | 0.9 | |
| Australia(a) | 20 605.5 | 265.7 | 1.3 | |
| |
| (a) Includes Other Territories comprising Jervis Bay Territory, Christmas Island and the Cocos (Keeling) Islands. |
Population growth, Quarterly
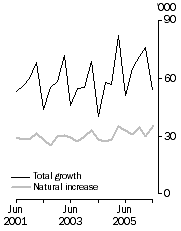
| Population growth rate, Year ended current quarter
|
JUNE KEY POINTS
ESTIMATED RESIDENT POPULATION
- The preliminary estimated resident population of Australia at 30 June 2006 was 20,605,500 persons, an increase of 265,700 persons (1.3%) since 30 June 2005 and 53,600 persons since 31 March 2006.
- The preliminary natural increase recorded for the year ended 30 June 2006 (131,200) was 5.4% (or 6,700 persons) higher than the natural increase recorded for the year ended 30 June 2005 (124,500).
- Preliminary net overseas migration for the year ended 30 June 2006 was 134,600 persons, an increase of 8.7% on the year ending 30 June 2005 (123,800).
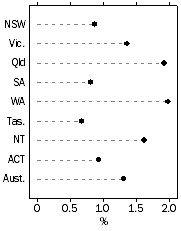
POPULATION GROWTH RATES
- The Australian population grew 1.3% during the 12 months ended June 2006. Natural increase and net overseas migration contributed 49% and 51% respectively to this total population growth.
- All states and territories experienced positive population growth over the 12 months ended 30 June 2006. Western Australia recorded the largest percentage gain (2.0%) and Tasmania the smallest (0.7%).
NOTES
FORTHCOMING ISSUES
| ISSUE (QUARTER) | Release Date |
| September 2006 | 22 March 2007 |
| December 2006 | 5 June 2007 |
| March 2007 | 24 September 2007 |
| June 2007 | 4 December 2007 |
| September 2007 | 19 March 2008 |
INTRODUCTION
Estimated resident population (ERP) data in this publication are based on the 2001 Census of Population and Housing. Exceptions are tables 17, 18 and 19 (excluding 2001 estimates), which are based on the 1996 Census of Population and Housing.
ERP DATA STATUS
At any point in time this publication contains final, revised and preliminary ERP data. The status of the ERP data included in this issue is as follows:
- Final - All ERP data up to and including June quarter 2001;
- Revised - ERP data from September quarter 2001 to June quarter 2005, inclusive;
- Preliminary - ERP data from September quarter 2005 to June quarter 2006, inclusive.
CHANGES IN THIS ISSUE
Changes included in this issue are as follows:
- An international comparisons table of population, growth rate and rank has been included in the Main Features;
- Preliminary infant mortality rates (IMR) for 2005-06 are published in table 12;
- Preliminary standardised death rates (SDR) for 2005-06 are published in table 11;
- Preliminary total fertility rates (TFR) for 2005-06 are published in table 10;
- Population estimates for Capital City Statistical Divisions and selected Statistical Districts have been revised for 2005. See table 5; and
- Population estimates for Australian External Territories have been updated to 30 June 2006. See table 7.
DATA NOT YET AVAILABLE
Progress is continuing with the review of annual household estimates methodology. See Tables 17, 18 and 19. A new methodology has been proposed and is currently being assessed. Implementation details will be made available once this assessment is complete.
RELATED PUBLICATIONS RECENT RELEASES
Population by Age and Sex, Australian States and Territories, June 2006 (cat. no. 3201.0) will be released on 13 December 2006. This issue will be the first release of animated population pyramids for each of the states and territories.
Information Paper: Evaluation of Administrative Data Sources for Use in Quarterly Estimation of Interstate Migration, 2006 to 2011 (cat. no. 3127.0.55.001) was released on 16 October 2006.
INQUIRIES
For further information about these and related statistics, contact the National Information and Referral Service on 1300 135 070 or Cassandra Eaves on Canberra (02) 6252 5640.
MAIN FEATURES
AUSTRALIA
Estimated resident population
The preliminary estimated resident population (ERP) of Australia at 30 June 2006 was 20,605,500 persons, an increase of 265,700 since 30 June 2005 and 53,600 persons since 31 March 2006.
Growth rates
The population growth rate for the year ended 30 June 2006 (1.3%) was slightly higher than that recorded for the year ended 30 June 2005 (1.2%). Over the last decade the population growth rate for Australia, for years ending 30 June, has varied between 1.0% in 1998 and 1.4% in 2001.
COMPONENTS OF POPULATION CHANGE
The growth of Australia's population has two components: natural increase (the number of births minus the number of deaths) and net overseas migration (net permanent and long-term movements).
Natural increase
Natural increase for the 12 months ended 30 June 2006 was 131,200 persons, an increase of 5.4% (or 6,700 persons) on the natural increase for the year ended 30 June 2005. The preliminary estimate for births of 264,300 in the year ended 30 June 2006 was 3.3% higher than the revised figure for the year ended 30 June 2005 (255,800). Over the same period, the preliminary estimate for deaths increased by 1.3%, removing 133,100 people from the Australian population.
Net overseas migration
The year ended 30 June 2006 recorded 457,400 permanent and long-term arrivals and 258,100 permanent and long-term departures. These, combined with a migration adjustment resulted in a net overseas migration (NOM) estimate of 134,600 persons. This was an 8.7% increase on the NOM estimate for the year ended 30 June 2005 (123,800).
The ABS applies a number of adjustments to the overseas arrivals and departures data used to produce estimates of NOM. These mainly comprise adjustments designed to reflect differences between stated travel intentions and actual travel behaviour, but (in the case of revised NOM estimates) also include adjustments to transform numbers of overseas movements into numbers of travellers. These are collectively referred to as 'migration adjustments'. For more information see the Technical Note - Measuring Net Overseas Migration (page 40).
PRELIMINARY DATA
Due to the collection and estimation methods applied to produce preliminary statistics, users should exercise caution when analysing and interpreting the most recent annual and quarterly estimates for births, deaths and net overseas migration, particularly when making time series comparisons. For analysis of fertility trends over time the Australian Bureau of Statistics (ABS) recommends users refer to Births, Australia (cat. no. 3301.0) - see paragraphs 7-9 of the Explanatory Notes for more detail.
STATES AND TERRITORIES
Estimated resident population
The estimated resident populations for the states and territories at 30 June 2006 were as follows: New South Wales 6,827,700, Victoria 5,091,700, Queensland 4,053,400, South Australia 1,554,700, Western Australia 2,050,900, Tasmania 488,900, the Northern Territory 206,700 and the Australian Capital Territory 328,800.
Growth rates
All states and territories recorded positive population growth over the 12 months ended 30 June 2006. Western Australia recorded the largest growth rate (2.0%), followed by Queensland (1.9%), the Northern Territory (1.6%), Victoria (1.4%), the Australian Capital Territory and New South Wales (0.9%), South Australia (0.8%) and Tasmania (0.7%).
Victoria's population growth rate over this period (1.4%) was its largest annual percentage growth since the year ending 30 June 1972 (1.7%). Similarly, Western Australia's population growth rate (2.0%) was its largest since 1990 (2.2%) and South Australia's (0.8%) largest since 1991 (1.0%).
COMPONENTS OF POPULATION CHANGE
Population growth in the states and territories has three components: natural increase, net overseas migration and net interstate migration.
Although all states and territories experienced positive population growth in the year ended 30 June 2006, the impact and proportion of each component varied between the states and territories.
Population Components, Year ended 30 June - States and territories - 2006
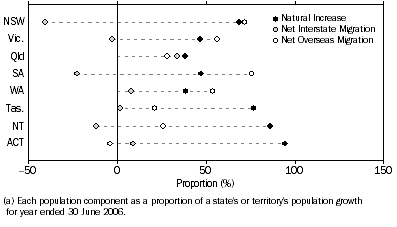
Natural increase
As illustrated in the graph above natural increase was the major component of population growth in the Australian Capital Territory (2,900 persons), the Northern Territory (2,800 persons), Tasmania (2,500 persons) and Queensland (29,200 persons) for the year ended 30 June 2006,.
The number of births registered for the 12 months ended 30 June 2006 increased for all states and territories. The Northern Territory recorded the largest percentage increase of 8.0%, Western Australia recorded a 6.9% increase while Tasmania and the Australian Capital Territory recorded increases of 6.7% and 4.0% respectively.
Deaths registered for the year ended 30 June 2006 showed Victoria with an annual decrease of -0.6%. All other states and territories recorded an increase in death registrations with the Australian Capital Territory up by 6.3%, Western Australia increasing by 5.9% and South Australia up 3.3% on the year ended 30 June 2005.
Net overseas migration
Net overseas migration for the year ended 30 June 2006, as illustrated in the previous graph, was the major component of population growth in South Australia (9,500), New South Wales (42,200 persons), Victoria (38,600 persons) and Western Australia (21,500 persons). All other states and territories experienced positive NOM except the Australian Capital Territory which lost 110 people.
As a component of population growth the NOM rate for the year ended 30 June 2006 was the highest recorded for South Australia (0.6%) since 30 June 1982. Likewise, Western Australia experienced its largest NOM rate (1.1%) since 30 June 1989.
Net interstate migration
Queensland experienced the highest positive net interstate migration with an increase of 25,800 persons for the 12 months ended 30 June 2006. Other states and territories to experience positive net interstate migration were Western Australia (3,100 persons), the Australian Capital Territory (270 persons) and Tasmania (60 persons). Negative interstate migration was experienced by New South Wales (-24,000 persons) , South Australia (-2,900 persons), Victoria (-1,900 persons ) and the Northern Territory (-390 persons).
NET INTERSTATE MIGRATION, States and territories
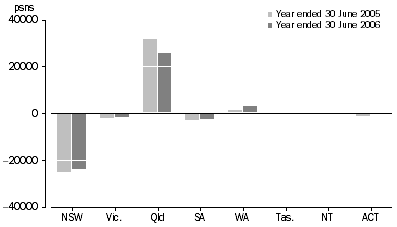
When compared to the same period of the previous year, there was a decrease of 16,400 persons moving interstate within Australia. Queensland and Tasmania experienced a decrease in gaining from net interstate migration, whereas New South Wales, South Australia and Victoria all experienced a decrease in their losses from net interstate migration. The Northern Territory changed from positive to negative net interstate migration, whereas the Australian Capital Territory showed the reverse. Western Australia continued it's increase in gaining population from net interstate migration for the year ended 30 June 2006.
INTERNATIONAL COMPARISON
For the 12 months ended 30 June 2006, Australia's population growth rate (1.3%) was slightly higher than that of the world (1.2%). Australia's growth rate was lower than Papua New Guinea (2.3%), Malaysia (1.8%), India (1.7%) and Singapore (1.5%). It was higher than Indonesia (1.3%), New Zealand (1.0%), United States of America (0.9%), Canada (0.9%), Thailand (0.7%), Hong Kong (0.6%), China (0.6%), and the United Kingdom (0.3%). Unlike Australia, Japan and Germany (0.0%) both experienced no change.
According to figures from the US Bureau of Census' International Data Base of 227 countries, Australia's population size ranked 54th in 2006 (down from 52nd in 2005) and is projected to rank 67th in 2050. By 2050, India is projected to have displaced China to become the most populous country with close to one fifth of the worlds population at 1.8 billion people.
Population, Growth Rate and Rank, Selected countries - at 30 June |
| |
| Estimated population | Projected population | Rank | |
| 2005 | 2006 | Growth
Rate | 2050 | 2006 | 2050 | |
| Country | million | million | % | million | no. | no. | |
| |
| Australia | 20.3 | 20.6 | 1.3 | 28.1 | 54 | 67 | |
| Canada | 32.8 | 33.1 | 0.9 | 41.4 | 36 | 44 | |
| China | 1 306.3 | 1 314.0 | 0.6 | 1 424.2 | 1 | 2 | |
| Germany | 82.4 | 82.4 | 0.0 | 73.6 | 14 | 22 | |
| Hong Kong (SAR of China) | 6.9 | 6.9 | 0.6 | 6.2 | 98 | 116 | |
| India | 1 093.6 | 1 111.7 | 1.7 | 1 807.9 | 2 | 1 | |
| Indonesia | 228.9 | 231.8 | 1.3 | 313.0 | 4 | 5 | |
| Japan | 127.4 | 127.5 | 0.0 | 99.9 | 10 | 17 | |
| Malaysia | 24.0 | 24.4 | 1.8 | 43.1 | 46 | 42 | |
| New Zealand | 4.0 | 4.1 | 1.0 | 4.8 | 122 | 125 | |
| Papua New Guinea | 5.5 | 5.7 | 2.3 | 10.7 | 106 | 92 | |
| Singapore | 4.4 | 4.5 | 1.5 | 4.6 | 119 | 129 | |
| Thailand | 64.2 | 64.6 | 0.7 | 69.3 | 19 | 25 | |
| United Kingdom | 60.4 | 60.6 | 0.3 | 64.0 | 22 | 28 | |
| United States of America | 295.7 | 298.4 | 0.9 | 420.1 | 3 | 3 | |
| World | 6 451.4 | 6 528.1 | 1.2 | 9 404.3 | . . | . . | |
| |
| . . not applicable |
| ABS for Australian estimates and projected populations (Series B); US Bureau of Census, International Data Base (IDB) for selected countries and world estimated and projected populations and all rankings. |
 Print Page
 Print All