Special Article - How long can I look forward to live? Mortality projections for 'real' cohorts (Sep Qtr 2001)
This article was published in Australian Demographic Statistics (Cat. no. 3101.0), September Quarter 2001.
INTRODUCTION
Life expectancy at birth is a well recognised and understood measure of mortality of a population. It is the average number of years a newly-born child can look forward to live if subject to a schedule of age-specific death rates throughout his/her life time. Life expectancy estimates are also calculated at other ages and are obtained from a life table which is solely derived from a schedule of age-specific death rates. A life table is called the 'period' or the 'cross-sectional' life table if it is calculated from the age-specific death rates observed in a particular year (or period). These rates actually represent the mortality experience of different generations of men or women in that year. An alternative method, the 'cohort' or the 'generation' life table is based on the age-specific death rates of the same generation of men or women experienced over time. As mortality improves year after year, the 'cross-sectional' life table which uses static rates does not correctly estimate the 'true' life expectancy which people may experience in their lifetime.
The life expectancy of a real cohort can only be estimated from the age-specific death rates as experienced by this cohort over time. In the same vein, the life expectancy of people alive at present can only be estimated from the assumed mortality rates that are likely to be experienced by these people from their current age to the end of their life. These life expectancy estimates are calculated in this article.
PROJECTIONS OF AUSTRALIAN MORTALITY
Cross-sectional life tables
In the process of making population projections, the ABS produces assumptions of future mortality rates and life tables. These life tables are 'cross-sectional' and are calculated for each sex for each year over the next 50 years from the base year. For the 1999-2101 series of population projections (Cat. no. 3222.0), the life tables were calculated for each year from 1997-98 to 2051-52, and the life tables for 2051-52 were assumed to apply for future years to 2100-011.
These annual life tables represent the assumed mortality experience of various generations of men and women during each financial year. In the current projections, the mortality rates are assumed to decline year after year. The expectations of life at birth of 76.3 years for males and 81.9 years for females in 1997-98 are assumed to increase to 83.4 years for males and 86.6 years for females in 2051-52.
Cohort life tables
The calculation of the cohort life tables follow the same principles as the cross-sectional life tables. The mortality rates, the q(x) values (the probability of dying between exact ages x and x+1), for a year are replaced by q(x) values which a person of a given age x is expected to experience at different ages (>x) in his/her remaining future life. The cohort mortality rates at various ages, taken from the cross-sectional mortality assumptions at the same ages but in different years (financial years), are the required input for the cohort life tables.
Using the Australian mortality assumptions, it is estimated that a man alive at age 90 in 1997 can, on average, expect to live for another 4.2 years, whereas a woman alive at the same age in 1997 can expect to live for another 4.8 years. Based on the 'static' cross-sectional life table for 1997-98, if the same person experiences the mortality of 1997-98 for the rest of life, his/her future life expectancy would be shorter (4.1 years for men and 4.7 years for women).
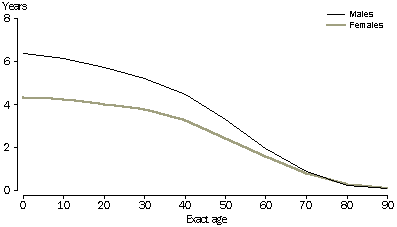
The difference between the cohort and cross sectional life expectancy estimates is substantial at the younger ages, as persons at the younger ages in 1997 are expected to experience lower mortality in their remaining life than the mortality of 1997-98. In 1997 at the age of 20 years men in a cohort life table could look forward to live for another 62.9 years (57.2 years in the cross-sectional life table for 1997-98) and women of the same age for another 66.5 years (62.5 years in the cross-sectional life table for 1997-98), a difference of 5.7 years for men and 4.0 years for women. This excess gain in life expectancy, which is even larger at age 0 (6.3 years for men and 4.3 years for women), is the outcome of the assumed reduction in mortality in the future, and depicts the 'real' life expectancy of children born in 1997-98 as long as the assumptions of mortality hold.
ADDITIONAL EXPECTATION OF LIFE(a)

(a) Excess expectation of life from cohort life table compared to cross sectional life table. For persons alive in 1997.
ADDITIONAL INFORMATION
Further information on life expectancy and deaths in general is available in Deaths, Australia, 2000 (Cat. no. 3302.0) released on 11 December 2001.
Reference
1 The standard mortality assumption in the latest series of population projections has life expectancy at birth of 83.3 years for males and 86.6 years for females in 2051. A second (high) assumption, developed for analytical purposes, assumes that the rate of improvement in life expectancy at birth experienced between 1986 and 1996 continues unabated for the next 50 years. This assumption has life expectancy at birth of 92.1 years for males and 93.4 years for females in 2051.
 Print Page
 Print All