MARCH KEY FIGURES
 | Mar qtr 14 | Dec qtr 13 to Mar qtr 14 | Mar qtr 13 to Mar qtr 14 |
 | $m | % change | % change |
TREND ESTIMATES(a) |
|
| Value of work done | 21 613.4 | 1.5 | 4.7 |
| New residential building | 10 992.6 | 2.5 | 5.3 |
| Alterations and additions to residential building | 1 770.5 | 0.6 | 2.2 |
| Non-residential building | 8 845.2 | 0.3 | 4.4 |
SEASONALLY ADJUSTED ESTIMATES |
|
| Value of work done | 21 822.5 | 3.7 | 6.4 |
| New residential building | 11 249.5 | 7.6 | 8.5 |
| Alterations and additions to residential building | 1 780.5 | 0.8 | 5.9 |
| Non-residential building | 8 792.4 | -0.3 | 4.0 |
|
| (a) Reference year for chain volume measures is 2011-12 |
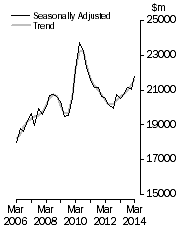
Value of work done, Chain volume measures

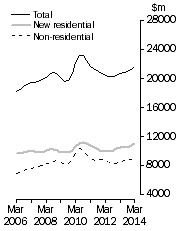
| Value of work done, Chain volume measures - Trend estimates

|
BUILDING WORK DONE
- The trend estimate of the value of total building work done rose 1.5% in the March quarter.
- The seasonally adjusted estimate of the value of total building work done rose 3.7% to $21,822.5m in the March quarter, following a fall of 0.4% in the December quarter.
NEW RESIDENTIAL BUILDING WORK DONE
- The trend estimate of the value of new residential building work done rose 2.5% in the March quarter. The value of work done on new houses rose 2.1%, while new other residential building rose 3.2%.
- The seasonally adjusted estimate of the value of new residential building work done rose 7.6% to $11,249.5m in the March quarter. Work done on new houses rose 5.3% to $6,700.6m, while new other residential building rose 11.1% to $4,549.0m.
NON-RESIDENTIAL WORK DONE
- The trend estimate of the value of non-residential building work done rose 0.3% in the March quarter.
- The seasonally adjusted estimate of the value of non-residential building work done fell 0.3% in the March quarter, following a fall of 0.2% in the December quarter.
DWELLING UNITS COMMENCED
 | Mar qtr 14 | Dec qtr 13 to Mar qtr 14 | Mar qtr 13 to Mar qtr 14 |
 | no. | % change | % change |
TREND ESTIMATES |
|
| Total dwelling units commenced | 47 920 | 6.3 | 18.3 |
| New private sector houses | 26 415 | 5.2 | 15.4 |
| New private sector other residential building | 20 417 | 8.3 | 25.2 |
SEASONALLY ADJUSTED ESTIMATES |
|
| Total dwelling units commenced | 48 964 | 8.7 | 22.2 |
| New private sector houses | 27 322 | 12.9 | 23.5 |
| New private sector other residential building | 20 577 | 4.4 | 26.3 |
|
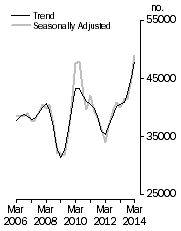
Dwelling units commenced

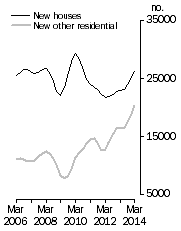
| Private dwellings commenced, Trend estimates

|
TOTAL DWELLINGS
- The trend estimate for the total number of dwelling units commenced rose 6.3% in the March quarter, following a rise of 6.1% in the December quarter.
- The seasonally adjusted estimate for the total number of dwelling units commenced rose 8.7% to 48,964 dwellings in the March quarter, following a rise of 8.7% in the December quarter.
NEW PRIVATE SECTOR HOUSES
- The trend estimate for new private sector house commencements rose 5.2% in the March quarter, following a rise of 5.0% in the December quarter.
- The seasonally adjusted estimate for new private sector house commencements rose 12.9% to 27,322 dwellings in the March quarter, following a rise of 0.2% in the December quarter.
NEW PRIVATE SECTOR OTHER RESIDENTIAL BUILDING
- The trend estimate for new private sector other residential building commencements rose 8.3% in the March quarter, following a rise of 8.6% in the December quarter.
- The seasonally adjusted estimate for new private sector other residential building rose 4.4% to 20,577 dwellings in the March quarter, following a rise of 23.1% in the December quarter.
NOTES
FORTHCOMING ISSUES
| ISSUE (QUARTER) | Release Date |
| June 2014 | 15 October 2014 |
| September 2014 | 15 January 2015 |
ABOUT THIS ISSUE
This publication updates the preliminary estimates released in Construction Work Done, Australia(cat. no. 8755.0) on 28 May 2014. The data in this publication are based on a response rate of approximately 90% of the value of building work done during the quarter. The data are subject to revision when returns from the following quarter are processed. Final data for the March quarter 2014 will be released in the next release of this publication, Building Activity, Australia (cat. no. 8752.0) on 15 October 2014.
SIGNIFICANT REVISIONS THIS ISSUE
Compared to the estimate published in Building Activity, Australia, December quarter 2013 (cat. no. 8752.0) released on 16 April 2014:
- the total value of work done in Australia during December quarter 2013 has been revised downwards by $24.6m or 0.1%.
- the total value of work commenced in Australia during December quarter 2013 has been revised upwards by $730.1m or 3.4%. This was driven by upwards revisions to non-residential commencements ($560.8m) and residential commencements ($169.3m).
- the number of dwelling unit commencements in the December quarter 2013 has remained practically unchanged (revised upwards by 2 dwellings).
DATA NOTE
Several time series spreadsheets contain 'np' (not available for publication) annotations from the September quarter 2012 onwards. This is due to confidential data being contained in these series.
As a result of changes to production processes, some time series identifiers will be changing. The content and nature of these series will not be affected.
The following publications will be affected:
To assist in accommodating these changes, Excel spreadsheets showing the old and new time series identifiers for each affected series are included under the downloads tab. Please note the dates on which these changes take effect, as detailed above.
INQUIRIES
For further information about these and related statistics, contact the National Information and Referral Service on 1300 135 070.
The
ABS Privacy Policy outlines how the ABS will handle any personal information that you provide to us.
 Quality Declaration
  Print Page
 Print All