APRIL KEY FIGURES
 |  | Apr 14 | Mar 14 to Apr 14 | Apr 13 to Apr 14 |
 |  | no. | % change | % change |
|
| TREND |  |  |  |
 | Total dwelling units approved | 15 813 | -1.6 | 15.1 |
 | Private sector houses | 9 421 | 0.5 | 19.5 |
 | Private sector dwellings excluding houses | 6 167 | -4.6 | 12.4 |
| SEASONALLY ADJUSTED |  |  |  |
 | Total dwelling units approved | 14 931 | -5.6 | 1.1 |
 | Private sector houses | 9 254 | -0.3 | 16.5 |
 | Private sector dwellings excluding houses | 5 435 | -14.0 | -16.6 |
|
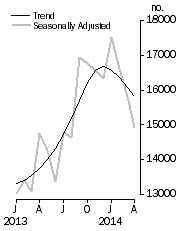
Dwelling units approved

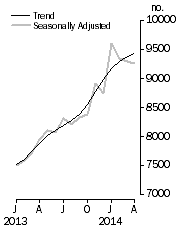
| Private sector houses approved

|
APRIL KEY POINTS
TOTAL DWELLING UNITS
- The trend estimate for total dwellings approved fell 1.6% in April and has fallen for four months.
- The seasonally adjusted estimate for total dwellings approved fell 5.6% in April and has fallen for three months.
PRIVATE SECTOR HOUSES
- The trend estimate for private sector houses approved rose 0.5% in April and has risen for 16 months.
- The seasonally adjusted estimate for private sector houses fell 0.3% in April and has fallen for three months.
PRIVATE SECTOR DWELLINGS EXCLUDING HOUSES
- The trend estimate for private sector dwellings excluding houses fell 4.6% in April and has fallen for five months.
- The seasonally adjusted estimate for private sector dwellings excluding houses fell 14.0% in April and has fallen for three months.
VALUE OF BUILDING APPROVED
- The trend estimate of the value of total building approved fell 5.6% in April and has fallen for five months. The value of residential building fell 1.8% and has fallen for four months. The value of non-residential building fell 12.8% and has fallen for five months.
- The seasonally adjusted estimate of the value of total building approved fell 17.4% in April and has fallen for four months. The value of residential building fell 7.4% and has fallen for two months. The value of non-residential building fell 36.6% and has fallen for four months.
NOTES
FORTHCOMING ISSUES
| ISSUE | Release Date |
| May 2014 | 3 July 2014 |
| June 2014 | 31 July 2014 |
| July 2014 | 2 September 2014 |
| August 2014 | 2 October 2014 |
| September 2014 | 3 November 2014 |
| October 2014 | 2 December 2014 |
DATA NOTES
A number of time series spreadsheets contain 'np' (not available for publication) annotations. This is due to confidential data being contained in these series.
As a result of changes to production processes which were implemented in March 2014, some time series identifiers have changed. The content and nature of these series will not be affected.
To assist in accommodating these changes, Excel spreadsheets showing the old and new time series identifiers for each affected series are included under the downloads tab.
REVISIONS THIS MONTH
Revisions to the total number of dwelling units approved in this issue are:
 | 2012-13 | 2013-14 | TOTAL |
|
| NSW | -15 | -3 | -18 |
| Vic. | 24 | 102 | 126 |
| Qld | 12 | 227 | 239 |
| SA | 2 | -6 | -4 |
| WA | 3 | 8 | 11 |
| Tas. | - | - | - |
| NT | 1 | -1 | - |
| ACT | - | - | - |
| Total | 27 | 327 | 354 |
|
INQUIRIES
For further information about these and related statistics, contact the National Information and Referral Service on 1300 135 070.
 Quality Declaration
  Print Page
 Print All