Page tools:
 Print Page Print Page
 Print All Print All
| ||||
Podcast: Duration: 8:34 min, filesize: 3.5MB, updated monthly, download transcript CONTENTS Article -Introduction -How many marriages? -Later childbearing -How many divorces? -Divorce and children -Looking ahead Additional Topics -Save the date... month and day of marriage in Australia -Marriage and divorce across the states and territories -International comparisons Explanatory Information -Data sources and definitions -Endnotes CRUDE MARRIAGE RATE - 1990 - 2010 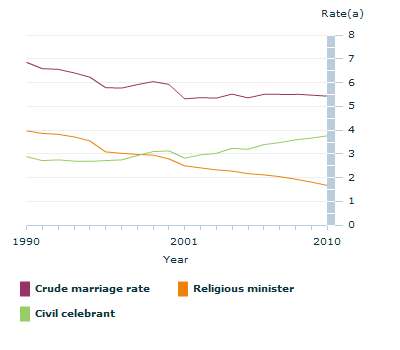 Footnote(s): (a) Marriages registered during a calendar year per 1,000 estimated resident population. Source(s): ABS 2010 Marriages and Divorces, Australia (cat. no. 3310.0); ABS 2008 Australian Historical Population Statistics (cat. no. 3105.0.65.001); ABS Australian Demographic Statistics Quarterly (cat. no. 3101.0) Marriage, Marriage statistics, Divorce, Divorce rates, Divorce statistics, Crude divorce rate, Wedding ceremony, Relationship, De facto relationship, Cohabitation before marriage, Separation, Religious marriage ceremony, Civil marriage ceremony, Effects of divorce , Age at first marriage, Marriage trends, Divorce trends, Family Law Act, Marriage Act, Family characteristics, Children INTRODUCTION Families are the building blocks of society, facilitating generational renewal, human interaction, and linking individuals to wider society as a whole. Relationships are closely linked with wellbeing, with families playing a key role in socialising children and shaping the future of society. Changing patterns in divorce and cohabitation over recent decades have resulted in differences in family structure; however families still remain a basic unit in society. While the rate of marriages registered in Australia each year has remained relatively stable in recent years, Australians have been marrying at an older age, and delaying having their first child until later in life. More Australians are in de facto relationships, and more are choosing non-religious ceremonies if they do decide to marry. This article looks at trends in marriage, de facto relationships and divorce between 1990 and 2010, as well as the effect of these trends on the family. HOW MANY MARRIAGES? Over the last two decades, the crude marriage rate fell from 6.9 registered marriages per 1,000 estimated resident population in 1990 to 5.4 marriages per 1,000 estimated resident population in 2010. This decline in part reflects a changing population structure. There were 121,000 marriages registered in 2010, the most recorded in a single year in Australia, and slightly more than the 120,000 marriages registered in 2009. Of the registered marriages in 2010, 31% were religious ceremonies, down from 58% in 1990. In contrast, in 2010, 69% of marriage ceremonies were conducted by civil celebrants, up from 42% in 1990. Living together In 2009-10, 11% (1.9 million) of Australians aged 18 years and over were living in a de facto relationship, while 53% were in a registered marriage. De facto relationships were most common amongst younger people, with one fifth (22%) of people aged 20-29 years living in these relationships, compared with nearly one tenth (9.4%) of people aged 40-49 years. The proportion of people aged 20-29 years living in a de facto relationship has doubled since 1992, where one tenth (10%) were living in one of these relationships. The rate for people aged 40-49 years has also nearly doubled (up from 4.7%) during this time. De facto relationships include those living in a same-sex relationship and in 2009-10 there were around 46,300 people living in a same sex couple. The majority of these couples had no children. COHABITATION PRIOR TO REGISTERED MARRIAGE - 1990 - 2010 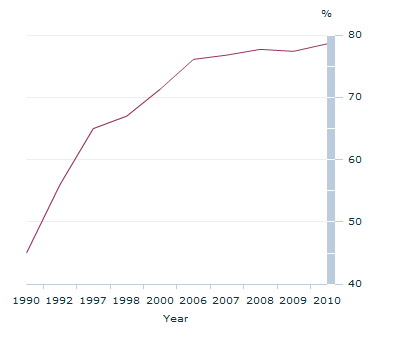 Cohabitation prior to registered marriage has increased over the last twenty years. In the early 1990s, just over half of all registered marriages were preceded by a period of cohabitation (56% in 1992).(Endnote 1) By 2010 it was almost eight in ten (79%). Many people in de facto couples expect their relationship to lead to marriage. In 2006-07, of the 1.6 million people aged 18 years and over who were in a de facto relationship, just over two fifths (42%) of them expected to enter into a registered marriage with their current partner. Age at first marriage Over the last twenty years, the average age at which Australians first marry has increased. In 2010, the median age at first marriage for men was 29.6 years and 27.9 years for women, an increase of more than three years since 1990 (26.5 years and 24.3 years respectively). Since 2002, the median age at first marriage for both men and women has remained relatively unchanged. There are many factors that may affect the age at which Australians first marry. These include the pursuit of higher education, the associated delay in labour force participation, the increasing social acceptance of cohabitation before marriage, and children moving out of the family home later in adulthood due to these factors. In 2006-07, 49% of men and 45% of women aged 18-24 years had never left the parental home, mainly for financial reasons (41%) or the convenience and/or enjoyment of living at home (36%). MEDIAN AGE AT FIRST MARRIAGE 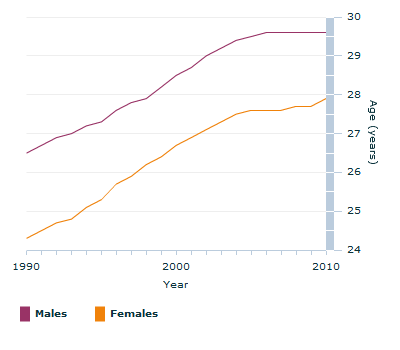 Source(s): ABS 2010 Marriages and Divorces (cat. no. 3310.0); ABS 2008 Australian Historical Population Statistics (cat. no. 3105.0.65.001) Marrying older The trend of marrying later in life has also been seen in the median age for all marriages (that is, when second and subsequent marriages are included). For men the median age for all marriages rose from 28.2 years in 1990 to 31.4 years in 2010, while for women, it increased from 25.9 years in 1990 to 29.2 years in 2010. In the twenty years to 2010, the age-specific marriage rate more than halved in the 20-24 years age group, dropping to 16.1 per 1,000 men (down from 44.0 in 1990), and 28.4 per 1,000 women (down from 66.0 in 1990). Conversely, in middle age groups, the rate increased. In 1990, the marriage rate for men aged 30-34 years was 27.7 per 1,000 men, rising to 35.7 in 2010. During this time the rate for women in this age group also increased from 20.8 to 31.4 per 1,000 women. AGE-SPECIFIC MARRIAGE RATE(a) - 1990 - 2010 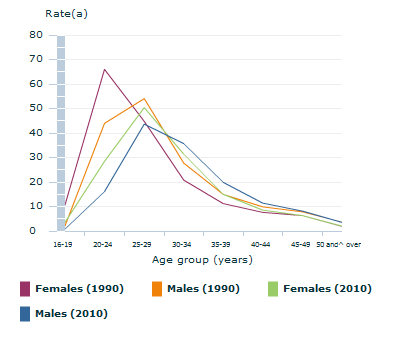 Footnote(s): (a) Marriages registered per calendar year per 1,000 estimated resident population by 5-year age groups. Source(s): ABS 2010 Marriages and Divorces, Australia (cat. no. 3310.0); ABS 2008 Australian Historical Population Statistics (cat. no. 3105.0.65.001) LATER CHILDBEARING A range of factors has influenced changes in Australia’s birth rates. While the age at marriage is increasing, more time spent on educational pursuits, and concerns regarding financial stability,(Endnote 2) have also contributed to these changes. While Australia’s total fertility rate has not changed significantly between 1990 and 2010 (1.90 babies per woman in 1990, compared with 1.89 babies per woman in 2010), the age at which women have their first baby has changed. In 1990, the median age of first-time mothers was 27.5 years. By 2010, this had increased to 28.9 years. Since 2000, women aged 30-34 years have continued to record the highest fertility rate of all age groups. In 1990, the fertility rate for this age group was 102 babies per 1,000 women, rising to 123 babies per 1,000 women in 2010. Further, since 2005 the fertility rate for women aged 35-39 years has exceeded that of women aged 20-24 years. Births outside of marriage The proportion of births occurring outside registered marriage has increased over the last two decades. Overall, unmarried women bear children at younger ages than women in registered marriages. In 2010, the median age of unmarried mothers was 27.3 years, just over three years older than in 1990 (24.0 years), and nearly four and a half years younger than the median age of married women giving birth in 2010 (31.7 years). The proportion of babies born outside registered marriage also rose during this time, from just over one fifth (22%) to just over one third (34%) of all births. Unmarried fathers also have children at younger ages. In 2010 the median age of unmarried fathers was 29.9 years compared with 34.0 years for married fathers. The median age of fathers has increased over the last twenty years, by 2.6 years for both married and unmarried fathers. BIRTHS OUTSIDE OF REGISTERED MARRIAGE - 1990 - 2010 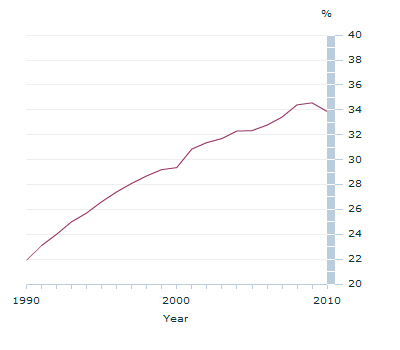 HOW MANY DIVORCES? Although more divorces were granted in 2010 (50,200) than in 1990 (42,600), the crude divorce rate was comparatively lower (2.3 divorces per 1,000 estimated resident population, down from 2.5). However, over the last two decades the crude divorce rate has varied. Rates during this period peaked in 1996 and 2001, at 2.9 divorces per 1,000 estimated resident population, while the lowest rate of 2.2 occurred in 2008. In part, the fluctuations in the crude divorce rate reflect both a changing population age structure, and a changing proportion of the population that is married. CRUDE DIVORCE RATE - 1990 - 2010 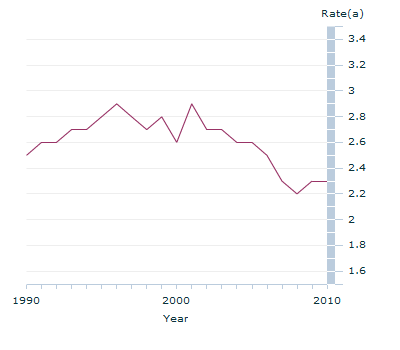 Footnote(s): (a) Divorces granted during a calendar year per 1,000 estimated resident population. Source(s): ABS 2010 Marriages and Divorces, Australia (cat. no. 331.0); ABS 2008 Australian Historical Population Statistics (cat. no. 3105.0.65.001) Years to separation and divorce The number of years to separation and divorce has remained stable since 2006, and recent divorce statistics show couples are married for longer before ending their marriage. In 2010, the median length of marriage before separation was 8.8 years, just over one year longer than in 1990 (7.5 years). The median length of time before divorcing increased by two years, from 10.2 years in 1990 to 12.3 years in 2010. Couples are also now separated for longer prior to divorce. In 1990, the average length of time between separation and divorce was 2.7 years. In 2010 this gap had increased to 3.5 years. Age at separation and divorce As couples are choosing to marry later in life, and marriages are lasting longer, couples also tend to divorce at older ages. In the last two decades, the median age at separation has increased by approximately six years for both men and women. In 2010, the median age for males at separation was 40.8 years, and 44.4 years at divorce, up from 35.3 years and 38.2 years respectively in 1990. Reflecting the age gap between men and women at marriage, the female median age at separation was 38.1 years, and 41.5 years at divorce, up from 32.4 years and 35.3 years in 1990. MEDIAN AGE AT DIVORCE - 1900 - 2010 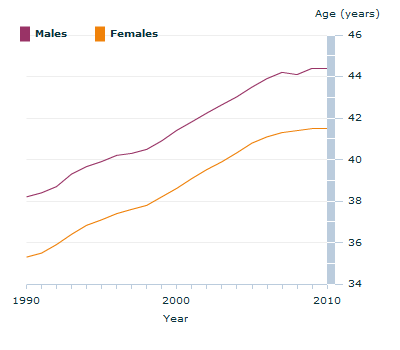 Source(s): ABS Marriages and Dvorces, Australia, 2010, 2002, 2001, 1998, 1997, 1996, 1995, 1994 (cat. no. 3310.0); ABS Divorces, Australia, 2004, 2003, 2002 (cat. no. 3307.0.55.001) DIVORCE AND CHILDREN Between 1990 and 2010, the proportion of divorces involving children decreased from 56% to 49%. Divorces between couples with children aged less than 18 years made up around half of all divorces in Australia in recent years. The proportion has remained relatively stable since declining to 50% in 2002. The reality of divorce means that many children live without regular contact with one of their parents (usually the father) after separation. In 2009-10, of the 5 million children aged 0-17 years, just over 1 million, or one in five (21%), had a natural parent living elsewhere. For four fifths (81%) of these children, the parent living elsewhere was their father. Of all children who had a natural parent living elsewhere, nearly half (48%) saw this parent at least once per fortnight, while one quarter (24%) saw them less than once per year or never. Nearly three quarters (73%) of children with a parent living elsewhere were in one parent families, 14% lived in step families, and 11% lived in blended families. DIVORCES INVOLVING CHILDREN(a)(b) - 1990 - 2010 (b) - 1990 - 2010.gif) Footnote(s): (a) As a proportion of all divorces. (b) Children aged under 18 years. Source(s): ABS 2010 Marriages and Divorces, Australia (cat. no. 3310.0); ABS 2008 Australian Historical Population Statistics (cat. no. 3105.0.65.001) LOOKING AHEAD The last two decades have seen changes in Australians’ relationship behaviour, the composition of families and the decision on when to have children. These changes will affect the ways couples and families form, interact and live together into the future. ADDITIONAL TOPICS
EXPLANATORY INFORMATION
ENDNOTES 1 Australian Bureau of Statistics, 1994, Focus on Families: Demographics and Family Formation, cat. no. 4420.0, Canberra, <www.abs.gov.au>.2 Gray, M., Qu, L. & Weston, R., 2008, Fertility and family policy in Australia: Research paper no. 41, Australian Institute of Family Studies, Melbourne, <www.aifs.gov.au >. Document Selection These documents will be presented in a new window.
|
||||
4102.0 - Australian Social Trends, March Quarter 2012
ARCHIVED ISSUE Released at 11:30 AM (CANBERRA TIME) 04/04/2012
This page last updated 25 June 2012

 - selected countries - 2009.gif)