4102.0 - Australian Social Trends, Sep 2011
ARCHIVED ISSUE Released at 11:30 AM (CANBERRA TIME) 22/09/2011
Page tools:
 Print Page Print Page
 Print All Print All
| ||||||||||||||||||||||||||||||||||||||||||||||||||||||||||||||||||||||||||||||||||||||||||||||||||||||||||||||||||||||||||||||||||||||||||||||||||||||||||||||||||||||||||||||||||||||||||||||||||||||||||||||||||||||||||||||||||||||||||||||||||||||||||||||||||||||||||||||||||||||||||||||||||||||||||||||||||||||||||||||||||||||||||||||||||||||||||||||||||||||||||||||||||||||||||||||||||||||||||||||||||||||||||||||||||||||||||||||||||||||||||||||||||||||||||||||||||||||||||||||||||||||||||||||||||||||||||||||||||||||||||||||||||||||||||||
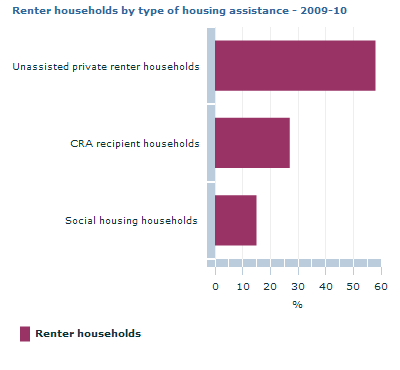
CONTENTS Article - Introduction - Types of assistance for renters - Recent trends in housing assistance - Who lives in assisted housing? - Affordability and tenure in social housing - What kind of dwelling? - Satisfaction and feelings of safety - Looking ahead Additional topics - Other housing assistance for renters Explanatory information - Data sources and definitions - Endnotes This will be replaced by the swf.  Source(s): ABS 2009-10 Survey of Income and Housing Access to affordable and suitable housing is a major determinant of the economic and social wellbeing of Australians. Australians are generally well housed, with about 70% of Australian households, in 2009-10, owning or purchasing their homes, and about 30% of Australian households renting. However many people, particularly those on low incomes, require assistance in accessing affordable and suitable housing. Recognising the fundamental importance of housing to individual and family wellbeing, and the impact that housing costs have on a household’s ability to meet other important needs, governments and not-for-profit community organisations provide a range of housing assistance programs to support renters in need. This article focuses on social (public and community) housing and Commonwealth Rent Assistance (CRA), and the characteristics of those people who receive these types of assistance. TYPES OF ASSISTANCE FOR RENTERS In 2009-10, 42% of renter households received some form of housing assistance. Of those, 65% were households receiving CRA, and 35% were households living in social housing. Commonwealth Rent Assistance The largest single component of housing assistance for renters is CRA. CRA is paid by the Australian Government to provide additional assistance to income support recipients and low income families in the private rental market. As at June 2010, CRA was paid to over 1.1 million singles and families, at an average of $98 per fortnight, and totalled nearly $3 billion. (Endnote 1) Social housing Social housing provides affordable and accessible housing on a priority basis to households with special needs or challenging circumstances. Social housing programs are managed by both state and territory governments and by community organisations. Together these services were provided to 15% of all renter households. Mainstream public rental housing accommodated around 81% of all households in social housing in Australia, while mainstream community housing accommodated around 11%. The balance of households were accommodated by State Owned and Managed Indigenous Housing (SOMIH) and Indigenous Community Housing (ICH). RECENT TRENDS IN HOUSING ASSISTANCE CRA is a very flexible form of housing assistance that can follow the recipients as they move to accommodate job mobility and other life changes. The number of singles and families receiving CRA has risen over the previous decade from 937,100 in 2000 to 1.1 million in 2010 (up 18%). Over the same period, mainstream public housing stock has declined from 348,600 in 2000 to 325,700 in 2010. However this decline has largely been offset by an increase in the mainstream community housing stock which has increased from 23,350 in 2000 to 42,560 in 2010 (excludes ICH). The growth in community housing is set to continue through the NRAS and the transfer of housing stock funded under the Social Housing Initiative of the Nation Building Economic Stimulus plan and the National Partnership Agreement on Social Housing. (Endnote 3) RECENT TRENDS IN HOUSING ASSISTANCE
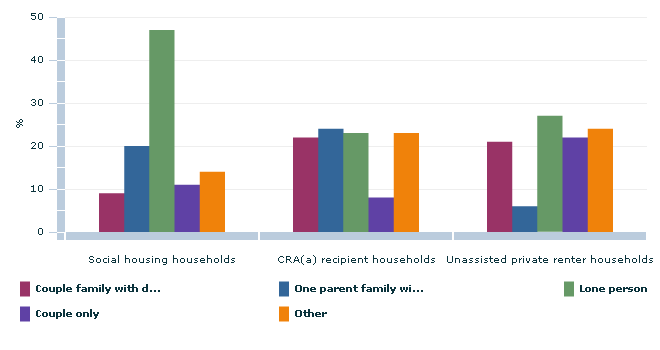
(a) Commonwealth Rent Assistance. (b) Estimates generally refer to June. (c) An income unit is a single person or family. (d) State Owned and Managed Indigenous Housing. (e) Data has been estimated for the number of Indigenous community housing dwellings in 2002, 2003, 2005 and 2010.The number for Indigenous community housing dwellings counted in the total include a small number of unoccupied dwellings. Source: Steering Committee for the Review of Government Service Provision, Report on Government Services, issues 2001-2011, <www.pc.gov.au> WHO LIVES IN ASSISTED HOUSING? Priority access to both public and community housing is typically given to people in greatest need. Greatest needs households are defined as households that, at time of allocation, are either homeless, in housing inappropriate to their needs, or in housing that is adversely affecting their health or placing their life or safety at risk. (Endnote 1) What kinds of families? The family composition of the household in which people live can vary according to the type of housing assistance received. In 2009-10, lone person households comprised 47% of all renter households in social housing, and 23% of households receiving CRA. One parent families made up 20% of renter households in social housing and 24% of renter households receiving CRA. In comparison, only 6% of unassisted renter households were one parent families. HOUSING ASSISTANCE TYPE BY FAMILY COMPOSITION OF HOUSEHOLD - 2009-10 This will be replaced by the swf.  Footnote(s): (a) Commonwealth Rent Assistance Source(s): ABS 2009–10 Survey of Income and Housing Age and sex Women were more likely than men to be living in renter households receiving assistance (55% compared with 45%). More than one-third of people living in renter households that were receiving some form of housing assistance were under the age of 18 years (37%), in part reflecting the high proportion of one parent families (largely headed by women) receiving such assistance. In comparison, 20% of those living in unassisted renter households were under the age of 18. There was a much higher proportion (18%) of older people, aged 65 years and over, living in social housing than in either CRA recipient households (8%) or unassisted renter households (1%). Employment About three-quarters of the adults renting social housing were not in the labour force, compared with 51% of those in CRA recipient households and 13% of those in unassisted private renter households. Conversely, 64% of people in unassisted private renter households were employed full time compared with much lower proportions in social housing and CRA recipient households (10% and 19% respectively). Disability Social housing households and those receiving CRA were much more likely to be home to people with a disability, partly reflecting the older age profile of people living in social housing. Of all renters living in social housing 67% reported having a disability, compared with 44% of those receiving CRA and 19% of renters receiving no housing assistance. HOUSING ASSISTANCE TYPE BY SELECTED PERSONAL CHARACTERISTICS - 2009-10
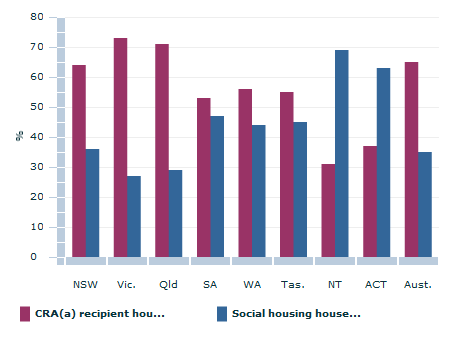
Source: ABS 2009-10 Survey of Income and Housing State and territory differences The mix of housing assistance to renters differed by state and territory. CRA was the predominant type of assistance across most jurisdictions (ranging from 53% in SA to 73% in Vic.), with the exceptions of the NT and the ACT where proportionally more households received assistance through social housing (69% and 63%). HOUSING ASSISTANCE TYPE BY STATE AND TERRITORY - 2009-10 This will be replaced by the swf.  Footnote(s): (a) Commonwealth Rent Assistance. Source(s): ABS 2009–10 Survey of Income and Housing AFFORDABILITY AND TENURE IN SOCIAL HOUSING On average, social housing bonds and rents are considerably lower than bonds and rents in the private rental market. This is because rents are capped so that they do not exceed a certain proportion of income. In 2007-08, those renting social housing averaged a weekly gross household income of $559 and weekly rent payments of $105. In comparison, CRA recipient households received $718 in weekly gross household income and paid $157 in weekly rent, on average, excluding CRA payments. In contrast, unassisted private renter households averaged more than three times as much gross weekly income ($1,719), and paid just over two and a half times as much rent ($278 per week on average). Far fewer households in social housing reported paying a rental bond (37%) compared with households in the private renter market (80% of CRA recipient households, 85% of unassisted renters). Of households who paid a rental bond, those renting social housing paid an average of $382. This was substantially lower than the amount that households paid in the private rental market. Private renters not receiving housing assistance paid an average of $1,194 in 2007-08 while those receiving CRA paid $888. In 2007-08, people aged 15 years and over living in social housing households had lived in their home for an average of seven years. Three-quarters of households renting social housing had life tenure (i.e. were able to continue living in their home for as long as they wanted). In comparison, people living in a home rented from a private landlord had lived in their home for an average of just two years for renters not currently receiving housing assistance and for CRA recipient households. Only 8% of unassisted renter households had indefinite tenure. HOUSING ASSISTANCE TYPE BY INCOME, HOUSING COSTS, AND TENURE - 2007-08
(b) Gross weekly income and weekly rent exclude CRA. Source: ABS 2007-08 Survey of Income and Housing WHAT KIND OF DWELLING? Separate houses are the predominant dwelling type for all tenures, including renters. However, in 2009-10 there were fewer households in social housing compared with other renter households living in separate houses (55% compared with 68% of CRA recipient households and 65% for private renters not receiving housing assistance). Households in social housing were also more likely to live in a townhouse (22% compared with 13% of CRA recipient households and 14% of unassisted renters). The proportion of households in flats was similar for each type of renter household. And in what condition? In 2007-08, the condition of rental dwellings varied by landlord type, with major structural problems of all kinds being most frequently reported by 28% of renters in social housing, compared with 21% of renters receiving no housing assistance. In 2009-10, in terms of overcrowding, in accordance with the Canadian National Occupancy Standard, (Endnote 4) 3% of all Australian households required one or more extra bedrooms, compared with 9% of CRA recipient households and 6% of social housing and private renter households not receiving assistance. Households receiving some form of assistance were less likely to have spare rooms with only 54% having at least one spare bedroom compared with 64% of unassisted private rental households. HOUSING ASSISTANCE TYPE BY DWELLING CHARACTERISTICS
(b) Data is for 2007-08. (c) Data is for 2009-10. Source: ABS 2007-08 and 2009-10 Survey of Income and Housing SATISFACTION AND FEELINGS OF SAFETY On measures of satisfaction, renters living in households receiving some form of housing assistance were more satisfied with their dwelling compared with other renters. Unassisted private renters were most satisfied with their location (90%), but least satisfied with the size of their block (57%). The feelings people have of safety or lack of safety when alone at home can relate to their understandings of local crime levels, previous experiences as a victim of assault or break-in, and in turn, their trust in, and relationships with, people in their local community as well as their personal sense of strength and ability to stay in control. In 2007-08, people living in social housing were less likely to feel safe at home alone after dark compared with unassisted private renters (74% compared with 87% respectively). HOUSING ASSISTANCE TYPE BY FEELINGS OF SAFETY AND SATISFACTION - 2007-08
Source: ABS 2007-08 Survey of Income and Housing LOOKING AHEAD CRA and social housing are likely to continue to dominate housing assistance in Australia over the coming years. There is currently investment in the social housing sector, particularly the community housing sector, with government initiatives such as the Nation Building - Social Housing Initiative which provides funding for the construction of around 19,600 new social housing dwellings. However, governments are also pursuing other initiatives, such as the National Rental Affordability Scheme, to improve the supply of affordable private rental housing to low and moderate income households. (Endnote 3) ADDITIONAL TOPICS
EXPLANATORY INFORMATION ENDNOTES 1. Steering Committee for the Review of Government Service Provision, Report on Government Services 2011, <www.pc.gov.au>2. Senate Standing Committee on Environment and Communications Legislation Committee, Answers to questions on notice Sustainability, Environment, Water, Population and Communities portfolio, <www.aph.gov.au>3. Department of Families, Housing, Community Housing, and Indigenous Affairs, Regulation and Growth of the Not-For-Profit Housing Sector: Discussion Paper, viewed 1 September 2011, <www.fahcsia.gov.au>4. According to the Canadian National Occupancy Standard for housing appropriateness. See paragraphs 24 to 26 of the Explanatory Notes in ABS Housing Occupancy and Costs, 2007-08 , cat. no. 4130.0 <www.abs.gov.au> Document Selection These documents will be presented in a new window.
|
||||||||||||||||||||||||||||||||||||||||||||||||||||||||||||||||||||||||||||||||||||||||||||||||||||||||||||||||||||||||||||||||||||||||||||||||||||||||||||||||||||||||||||||||||||||||||||||||||||||||||||||||||||||||||||||||||||||||||||||||||||||||||||||||||||||||||||||||||||||||||||||||||||||||||||||||||||||||||||||||||||||||||||||||||||||||||||||||||||||||||||||||||||||||||||||||||||||||||||||||||||||||||||||||||||||||||||||||||||||||||||||||||||||||||||||||||||||||||||||||||||||||||||||||||||||||||||||||||||||||||||||||||||||||||||
