4102.0 - Australian Social Trends, March Quarter 2012
ARCHIVED ISSUE Released at 11:30 AM (CANBERRA TIME) 28/03/2012
Page tools:
 Print Page Print Page
 Print All Print All
| ||||||||||||||||||||||||||||||||||||||||||||||||||||||||||||||||||||||||||||||||||||||||||||||||||||||||||||||||||||||||||||||||||||||||||||||||||||||||||||||||||||||||||||||||||||||||||||||||||||||||||||||||||||||||||||||||||||||||||||||||||||||||||||||||||||||||||||||||||||||||||||||||||||||||||||||||||||||||||||||||||||||||||||||||||||||||||||||||||||||||||||||||||||||||||||||||||||||||||||||||||||||||||||||||||||||||||||||||||||||||||||||||||||||||||||||||||
Podcast: Duration: 10:09 min, filesize: 4.6MB, updated monthly, download transcript CONTENTS Article -Introduction -People in low economic resource households -Income and wealth -Expenditure patterns of low economic resource households -Financial stress -Looking ahead Additional topics -Government benefits, taxes and income distribution Explanatory information -Data sources and definitions -Endnotes Related Terms the poor, poor people, the working poor, financial stress, what people buy, household expenditure, income and expenditure, total expenditure, average Australia income, Australian wealth, Australian government benefits, taxes Australia, financial hardship, low income, disposable income, Standard of living, characteristics of people, wealth, disparity INTRODUCTION People’s material standard of living is largely determined by their access to economic resources and the consumption possibilities this provides. While regular income is an important economic resource for many people, wealth in the form of bank accounts, shares, superannuation or property can be drawn upon to smooth and support consumption over time, including during periods of low income. (Endnote 1) This article looks at the characteristics of people in households with both relatively low income and relatively low wealth (low economic resources). The advantage of taking into account wealth as well as income is that it excludes those with high wealth who enjoy reasonable levels of consumption despite a low level of income. This approach is therefore more likely to capture people most at risk of experiencing economic hardship, than analyses of income alone. PEOPLE IN LOW ECONOMIC RESOURCE HOUSEHOLDS Australia experienced almost two decades of economic growth from the end of the recession of the early 1990s to the start of the downturn associated with the Global Financial Crisis in the late 2000s. This led to increases in income and wealth, but the benefits have been felt by some more than others. In 2009-10, nearly one in four people (23% or 4.9 million people) lived in households that were in the lowest two quintiles of both equivalised adjusted disposable household income and the lowest two quintiles of equivalised household net worth. These low economic resource households have, on average, more household members (2.9 people) than other households (2.5 people). Children were twice as likely as adults to live in low economic resource households. In 2009-10, 1.6 million children aged 0 to 14 years (38%) lived in low economic resource households, compared with 3.3 million people aged 15 years and over (19%). PEOPLE AND HOUSEHOLDS BY ECONOMIC RESOURCES - 2009-10
Source: ABS 2009-10 Survey of Income and Housing . . not applicable INCOME AND WEALTH A person’s economic resources and their potential standard of living are related to their household’s characteristics. In 2009-10, the average weekly equivalised adjusted disposable household income of people in low economic resource households ($465) was less than half (45%) that of people in other households ($1,033). After adjusting for inflation, incomes of those in households with low economic resources increased in real terms by 21% between 2003-04 and 2009-10, compared with a 27% rise across other households. (Endnote 2) This disparity between people in low economic resource households and the rest of the population is even more pronounced when it comes to wealth. The average equivalised net worth of people in households with low economic resources in 2009-10 ($53,500) was one tenth of the average across other households ($509,800). After adjusting for inflation, the net worth of low economic resource households had not increased significantly since 2003-04, while the average net worth across all other households had increased by 29%. These data indicate that the disparity in both income and wealth between those in low economic resource households and the rest of the population had grown over the six years to 2009-10. INCOME, EXPENDITURE AND WEALTH BY ECONOMIC RESOURCES - 2009-10
(b) Adjusted to include imputed rent. Source: ABS 2009-10 Survey of Income and Housing; ABS 2009-10 Household Expenditure Survey Household composition In 2009-10, one in five (20% or 1.7 million) households were classified as having low economic resources. The proportion varied according to the composition of the household and the age of the household members, reflecting the fact that people are at greater risk of economic hardship at particular stages in the life course. Among households comprising one parent with dependent children, three in five (59%) were classified as having low economic resources. One parent households accounted for only 6% of all households, but made up 18% of low economic resource households. Couples with only dependent children were also more likely than average to have low economic resources (24%). Among these households, those whose eldest child was aged less than 15 years were more likely to have low economic resources (27%) than those with older children (18%). The proportion of households classified as having low economic resources increased with the number of children in the household - from 28% of households with one child aged less than 15 years, to 33% of those with two children, and 49% of households with three or more children aged less than 15 years. The likelihood of having low economic resources was much lower among households with older couples and those without dependent children. Only 6% of households comprising a couple with non-dependent children fell into the low economic resource category. Older couples living by themselves were also less likely than average to have low economic resources, regardless of whether the reference person was aged 55-64 years (6%), or 65 years and over (8%). While lower income levels were quite common among households comprising a couple aged 65 years and over (63% were in the lowest two quintiles of income), relatively higher levels of wealth among these households (only 13% were in the lowest two quintiles of net worth) explains why relatively few were counted among low economic resource households. Among older people, living alone was associated with a greater risk of economic hardship. One in five (20%) people aged 65 years and over who were living alone were considered to have low economic resources. LOW ECONOMIC RESOURCE HOUSEHOLDS AS A PROPORTION OF HOUSEHOLDS IN SELECTED LIFE CYCLE GROUPS - 2009-10 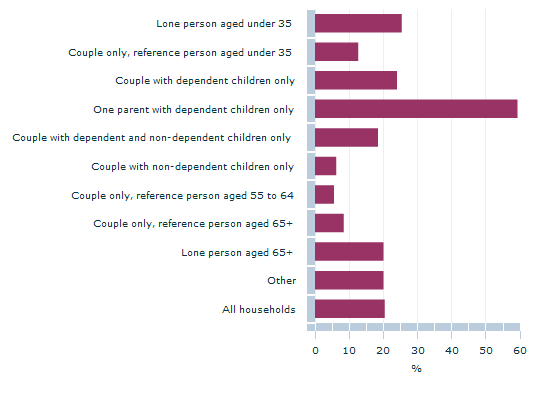 Source(s): ABS 2009-10 Survey of Income and Housing Work Employment plays a key role in economic wellbeing for many people as it is the main way people obtain the economic resources needed to support current household living expenses as well as to save for retirement. Depending on circumstances, a lack of employment for household members may increase the risk of economic hardship. The average number of people employed in low economic resource households in 2009-10 was considerably lower than in other households (0.8 compared with 1.4 people). The average hours of paid work, in total by all members in households with low economic resources (27 hours per week), was half that of other households (54 hours per week). These differences are partly due to the lower proportion of people of working age in low economic resources households. Households with no-one employed were twice as likely to have low economic resources (32%) as those with at least one person employed (16%). Similarly, households where only one person was employed were twice as likely to have low economic resources (24%) as those where two people were employed (11%). The importance of employment to household economic wellbeing was particularly apparent for those with young children. Of households comprising a couple with dependent children where no-one was working, 70% were identified as having low economic resources, compared with only 22% where at least one person was working. Among one parent households with dependent children where no-one was employed, 88% had low economic resources, compared with 42% in which someone was employed. Having someone in the household employed does not necessarily guarantee relatively higher economic resources. In 2009-10, more than a third (37%) of households with one part-time worker only, fell within the low economic resource group. Even among households with one full-time worker only, one in five (20%) had low economic resources. SELECTED HOUSEHOLD CHARACTERISTICS BY ECONOMIC RESOURCES - 2009-10
(b) Median age refers to the age which divides the group into two equal parts, one half being below this age, the other half being above. (c) Total average hours worked by all household members in their main and second job. Source: ABS 2009-10 Survey of Income and Housing Main source of income The lower levels of employment among low economic resource households were reflected in relatively high reliance on government pensions and allowances. Of people in low economic resource households in 2009-10, 44% relied on government pensions and allowances as their main source of household income. This compares with 13% of people across other households. Around half of people in low economic resource households (49%) had wages and salary as their main source of household income, compared with nearly three quarters (73%) of people across other households. Of those living in one parent households with low economic resources, nearly three-quarters (74%) relied on government pensions and allowances as their main source of household income. In lone person and couple only households where the reference person was 65 years and over and which had low economic resources, 99% relied on government pensions and allowances as their main source of income. Housing People’s command over economic resources can influence their housing opportunities and particularly their chances of owning their own home. Less than a third (32%) of people in low economic resource households lived in an owner occupied dwelling (and only 4% in mortgage free dwellings), compared with 82% of other people (including 34% in mortgage free dwellings). The lower ownership rates partly reflect the younger age profile of those in low economic resource households, with many at a stage in the life course during which home ownership is less common. Those in low economic resource households were much more likely to be renting in public housing (13% compared with 1% across all other households). As might be expected, 89% of all public housing tenants lived in low economic resource households. EXPENDITURE PATTERNS OF LOW ECONOMIC RESOURCE HOUSEHOLDS While information on people’s economic resources (i.e. their income and wealth) provides insight into their consumption possibilities, expenditure on goods and services provides information about their actual consumption, and gives an indication of their material standard of living. In 2009-10, the average weekly equivalised expenditure (adjusted to include imputed rent) on goods and services of people in low economic resource households ($500) was 57% of the average expenditure of other households ($872). Between 2003-04 and 2009-10, after controlling for inflation, the weekly equivalised adjusted household expenditure of people in low economic resource households increased by 14% ($61). The average expenditure of other households increased by 17% ($126) over the same period. Housing, food and transport were the broad expenditure items that accounted for the largest proportion of expenditure on goods and services across both low economic resource households and other households. Among those in low economic resource households, these items accounted for 57% of total expenditure, while for those in other households they accounted for 45%. The equivalised expenditure on housing of those who lived in low economic resource households ($133 per week) was similar to that of people in other households ($130). However, housing represented a greater proportion of total expenditure on goods and services for those in low economic resource households (27% compared with 15%). The average weekly equivalised expenditure on food among low economic resource households ($89) was 67% of that spent by other households ($132). Transport costs accounted for 13% of total goods and services expenditure among low economic resource households and 15% for other households. In terms of levels, the equivalised expenditure on transport among low economic resource households ($62 per week) was less than half that among other households ($130), on average. It was a similar situation with expenditure on recreation, with low economic resource households spending 10% of their total expenditure on recreation, compared with 12% for people in other households. However, those in low economic resource households had considerably lower equivalised expenditures on recreation ($50 per week) than people in other households ($108). People in low economic resource households had lower equivalised expenditures on medical and health care than those in other households, both in proportional terms (3% and 5%, respectively), as well as levels ($15 and $45 per week, respectively). This may be due to the younger age profile of people in low economic resource households. Additionally, two-thirds (67%) of low economic resource households had at least one person who had access to subsidised health care through government concession cards, compared with one-third (34%) of other households. WEEKLY EQUIVALISED EXPENDITURE BY ECONOMIC RESOURCE - 2009-10
(b) Adjusted to include imputed rent. Source: ABS 2009-10 Household Expenditure Survey; ABS 2009-10 Survey of Income and Housing FINANCIAL STRESS While people who are comparatively well off can experience financial stress and perceptions of stress can vary within a household, different rates of stress observed across groups can provide valuable additional insights into their relative material wellbeing. SELECTED INDICATORS OF FINANCIAL STRESS(a) BY ECONOMIC RESOURCES - 2009-10
(b) People in the two lowest quintiles for both equivalised adjusted disposable household income (adjusted to include imputed rent) and equivalised net worth. Source: ABS 2009-10 Survey of Income and Housing Ability to save income In 2009-10, 17% of households with low economic resources reported being able to save money most weeks, compared with 46% of other households. Around a quarter (24%) of low economic resource households reported spending more money than they received most weeks, twice the rate of other households (12%). This gives an indication of the extent to which people, particularly in low economic resource households, may be forced to draw upon their limited assets or rely on credit from week to week simply to make ends meet. Ability to raise emergency money An important element of financial security is the ability to meet unexpected expenses. In 2009-10, 43% of low economic resource households reported that they would not be able to raise $2,000 in a week for something important. In contrast, only 7% of other households reported being in this position. Other indicators of financial stress A range of other indicators of financial stress were more prevalent among low economic resource households: 10% reported that they had gone without meals in the past 12 months due to cash flow problems, while 8% had resorted to pawning or selling possessions. By contrast, only 1% of other households had been forced to either of these lengths. Close to a third (31%) of low economic resource households reported that they had been unable to pay a utility bill on time in the past 12 months, and 20% had sought financial help from friends or family due to cash flow problems. This compares with 8% and 5%, respectively, among other households. One in ten (10%) low economic resource households were forced to seek assistance from welfare or community organisations, compared with 1% of other households. LOOKING AHEAD While there will always be disparities between households in terms of income and wealth, the tax and transfers system, along with other government interventions, serve to minimise the risk of economic hardship, particularly at critical points in the life course. The 2011 Henry review into Australia’s tax and transfer system outlined a number of challenges facing the country over the coming decades. (Endnote 3) These include the need to increase participation and productivity in the workforce; maintain the adequacy and sustainability of the tax and transfer system in the context of an ageing population; increase retirement savings through the superannuation system; and increase housing affordability. These key directions were set with a view to the importance of policies that not only redistribute income but that also promote growth of incomes at all levels. ADDITIONAL TOPICS EXPLANATORY INFORMATION
ENDNOTES 1 Australian Bureau of Statistics, 2001, Measuring Wellbeing: Frameworks for Australian Social Statistics, 2001, cat. No. 4160.0 <www.abs.gov.au>2 Estimates of income for 2003-04 are not directly comparable with 2009-10 due to improvements in measuring income. Estimates for 2003-04 have been recompiled to reflect the new treatment of income, where data are available to support this calculation.3 Australian Government 2011, Australia’s future tax system, viewed 27 February 2012 <www.taxreview.treasury.gov.au> Document Selection These documents will be presented in a new window.
|
||||||||||||||||||||||||||||||||||||||||||||||||||||||||||||||||||||||||||||||||||||||||||||||||||||||||||||||||||||||||||||||||||||||||||||||||||||||||||||||||||||||||||||||||||||||||||||||||||||||||||||||||||||||||||||||||||||||||||||||||||||||||||||||||||||||||||||||||||||||||||||||||||||||||||||||||||||||||||||||||||||||||||||||||||||||||||||||||||||||||||||||||||||||||||||||||||||||||||||||||||||||||||||||||||||||||||||||||||||||||||||||||||||||||||||||||||
