|
|
MAIN FEATURES
- At June 2016, the median age of the Australian population (the age at which half the population is older and half is younger) was 37.2 years, up from 36.7 years at June 2006. The median age of males at June 2016 was 36.4 years while the median age of females was 38.1 years.
- Hobart had the oldest median age of all capital cities, at 39.7 years, ahead of Adelaide at 38.6 years. Darwin was the youngest capital city with a median age of 33.5 years, followed by the Australian Capital Territory at 34.7 years.
- At June 2016, there were 187,100 more females than males residing in Australia, with 12.01 million males and 12.20 million females. The sex ratio (the number of males per hundred females) was 98.5. The sex ratio of all greater capital cities combined (98.4) was lower than for the rest of Australia (98.7).
- With the exception of New South Wales, Tasmania and the Northern Territory, the ratio of males to females was lower in the capital city than in the rest of the state or territory. Adelaide (96.9) had the lowest sex ratio of all capital cities, while Darwin (109.5) had the highest. Darwin was the only capital city where males outnumbered females.
SEX RATIOS AND MEDIAN AGES - Greater Capital City Statistical Areas (GCCSAs), 2016 |
|
 | Sex Ratio | Median Age(a) |
| GCCSA | males per 100 females | years |
|
| Greater Sydney | 98.5 | 35.8 |
| Greater Melbourne | 97.7 | 35.7 |
| Greater Brisbane | 98.0 | 35.2 |
| Greater Adelaide | 96.9 | 38.6 |
| Greater Perth | 99.9 | 35.8 |
| Greater Hobart | 98.7 | 39.7 |
| Greater Darwin | 109.5 | 33.5 |
| Australian Capital Territory | 98.8 | 34.7 |
 |
| Total Greater Capital Cities | 98.4 | 35.9 |
 |
| Total Australia | 98.5 | 37.2 |
|
| (a) The age at which half the population is older and half is younger. |
- The Statistical Areas Level 2 (SA2s) with the highest median ages were Tea Gardens - Hawks Nest (61.6 years) and Tuncurry (60.7) in New South Wales, Bribie Island (59.0) in Queensland and Sussex Inlet - Berrara (58.9) on the New South Wales south coast. These areas are all popular retirement destinations.
- Many of the SA2s with the youngest median ages also had large populations of students or military personnel, including Acton (20.9 years) and Duntroon (21.4) in the Australian Capital Territory, or high proportions of Aboriginal and Torres Strait Islander people, such as Northern Peninsula (22.0) and Yarrabah (22.9) in Queensland.
SA2s WITH OLDEST AND YOUNGEST MEDIAN AGES(a), 2016 |
|
 |  | Median Age |
| SA2 | GCCSA | years |
OLDEST MEDIAN AGES |
|
| Tea Gardens - Hawks Nest | Rest of NSW | 61.6 |
| Tuncurry | Rest of NSW | 60.7 |
| Bribie Island | Greater Brisbane | 59.0 |
| Sussex Inlet - Berrara | Rest of NSW | 58.9 |
| Point Lonsdale - Queenscliff | Rest of Vic. | 58.3 |
YOUNGEST MEDIAN AGES |
|
| Acton | Australian Capital Territory | 20.9 |
| Duntroon | Australian Capital Territory | 21.4 |
| Northern Peninsula | Rest of Qld | 22.0 |
| Yarrabah | Rest of Qld | 22.9 |
| St Lucia | Greater Brisbane | 23.7 |
|
| (a) Excludes SA2s with a population of less than 1,000 at June 2016. |
- The SA2 with the highest sex ratio was Howard Springs (274.7 males per 100 females) in Darwin, home of the Darwin Correctional Centre. This was followed by East Pilbara (265.1) and Ashburton (251.2), which are areas with significant mining activity in Western Australia. The lowest sex ratio was in the SA2 of Deakin (81.3) in the Australian Capital Territory, followed by Castle Hill - East (83.2) in Sydney and Page (84.9) in the Australian Capital Territory.
SA2s WITH HIGHEST AND LOWEST SEX RATIOS(a), 2016 |
|
 |  | Sex Ratio |
| SA2 | GCCSA | males per 100 females |
HIGHEST SEX RATIOS |
|
| Howard Springs | Greater Darwin | 274.7 |
| East Pilbara | Rest of WA | 265.1 |
| Ashburton | Rest of WA | 251.2 |
| Duntroon | Australian Capital Territory | 247.0 |
| Chidlow | Greater Perth | 240.2 |
LOWEST SEX RATIOS |
|
| Deakin | Australian Capital Territory | 81.3 |
| Castle Hill - East | Greater Sydney | 83.2 |
| Page | Australian Capital Territory | 84.9 |
| Woollahra | Greater Sydney | 85.6 |
| Coombabah | Rest of Qld | 85.6 |
|
| (a) Excludes SA2s with a population of less than 1,000 at June 2016. |
AGE AND SEX DISTRIBUTION
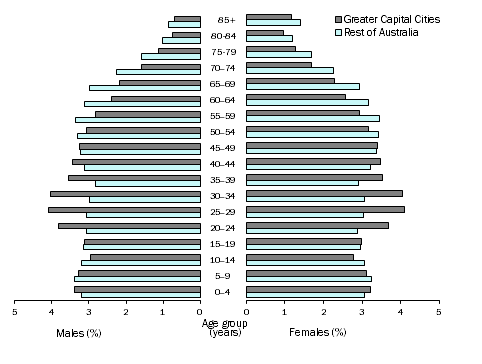
- The following graph (called a 'population pyramid') compares the age/sex structure of the population residing in greater capital cities with the population residing in the rest of Australia. Each dark bar illustrates the percentage contribution of a sex and five-year age group to the total population of capital cities, while each light bar illustrates the percentage contribution to the rest of Australia's population. For example, the graph shows that in June 2016, males aged 0 to 4 years made up 3.4% of the population of the combined capital cities compared with 3.2% of the rest of Australia.
- A distinctive feature in the age distribution of Australia at June 2016 was the higher representation of people aged 20 to 44 years residing in capital cities. People in this age group represented 38% of the combined capital city population, compared with 30% of the population in the rest of Australia. This reflects the attraction of younger adults to education, employment and other opportunities in capital cities. In contrast, older adults aged 45 years and over made up a smaller proportion of the population in capital cities (37%) than in the rest of Australia (45%).
- The population pyramid also highlights differences between the sexes. For June 2016, the most notable feature was the higher proportions of females than males in the older age groups. This was evident in both capital cities and in the rest of Australia. The difference was most marked among the population aged 85 years and over, and is attributable to the longer life expectancy of female Australians.
AGE AND SEX DISTRIBUTION (%), Greater capital cities and rest of Australia - 30 June 2016

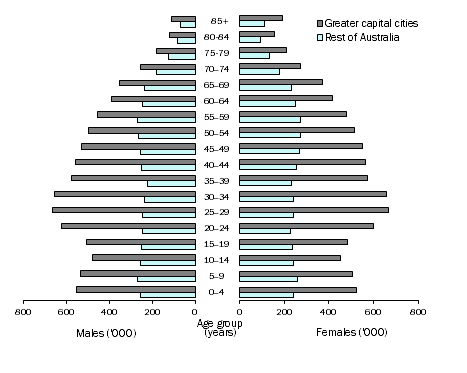
- In 2016, 16.24 million people (two thirds of the population) resided in greater capital cities and 7.97 million (one third) resided in the rest of Australia. Females outnumbered males in both capital cities (8.18 million females to 8.05 million males) and the rest of the country (4.01 million females to 3.96 million males).
AGE AND SEX DISTRIBUTION ('000), Greater capital cities and rest of Australia - 30 June 2016

|
|
 Quality Declaration
  Print Page
 Print All