APPENDIX 1 PRODUCT SUPPLY AND USE GRAPHS
INTRODUCTION
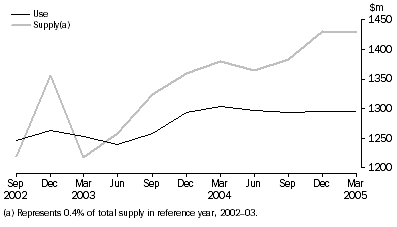
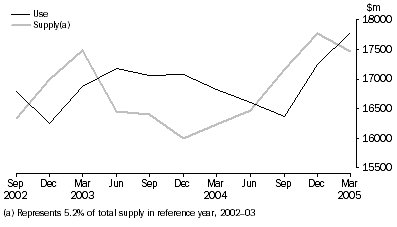
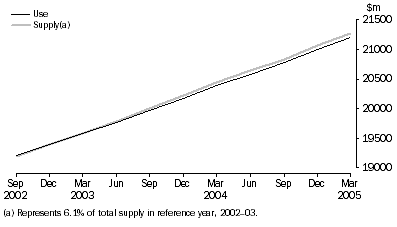
The following graphs show the supply and use of the 33 product groups identified in the QSU model as at the time of the compilation of the March 2005 quarterly national accounts. The product groups differ in complexity and the problems they present for data editing. In general, goods present more complex problems than services because they can be held as inventories and are subject to trade and transport margins. Data on inventories are not readily available at the product level, and margins must be estimated using reference year relationships and the aggregate output of the trade and transport industries.
The complexity of a product group in terms of the amount of data used to compile supply and use series does not always indicate the difficulty of balancing supply and use for that group. The quality of the data available quarterly is also a factor. The supply and use of complex product groups can be closely correlated if good quality data are available for all components, while relatively simple product groups can be difficult to balance if reliable data are not available.
The relative significance of each product group in terms of its contribution to total supply is shown as a footnote to each graph. The percentage of total supply of each product group in the reference year gives an indication of the contribution of that product group to GDP. The contribution to GVA would be preferred, but it is only available for industries, not products. It should be noted that different scales have been used on the graphs, so care should be taken in assessing the significance of supply and use discrepancies for the whole economy.
GRAPHS
Agricultural products
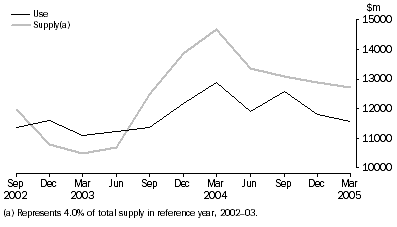 Forestry & fishing
 Mining products
 Services to mining
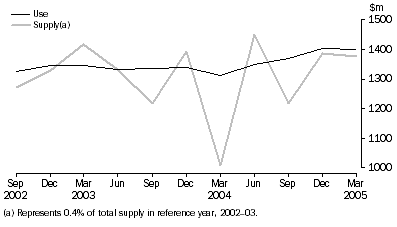 Manufactured food, beverages & tobacco
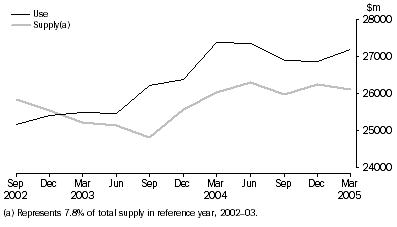 Textiles, clothing & footwear
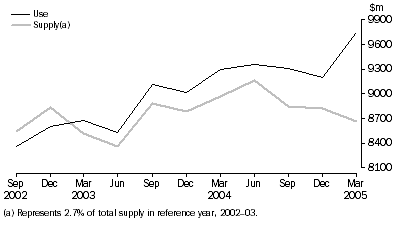 Wood & paper products
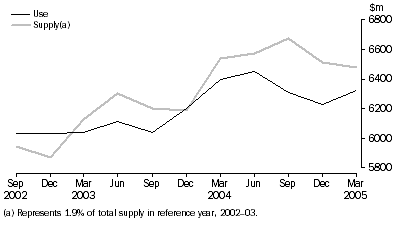 Printing & publishing products
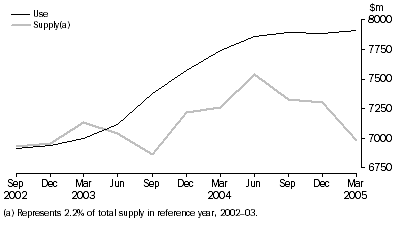 Petroleum, coal & chemical products
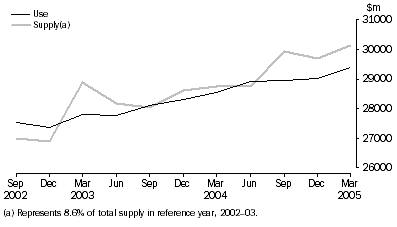 Non-metallic mineral products
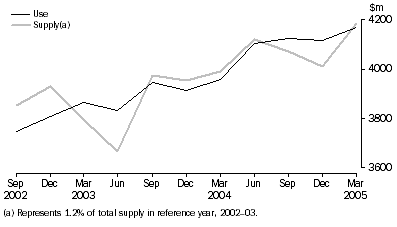 Metal products
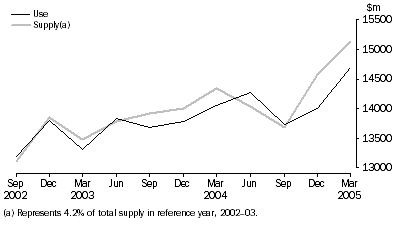 Machinery & equipment
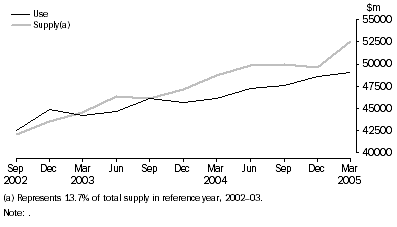 Other manufactured products
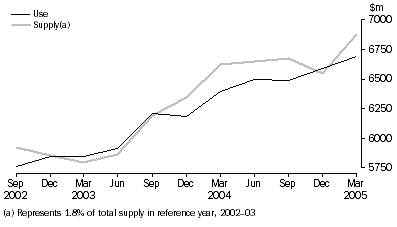 Electricity
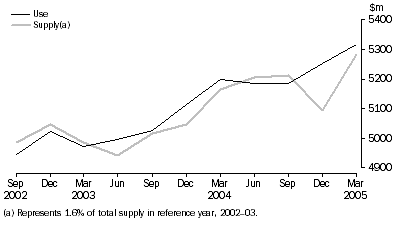 Gas
Gas
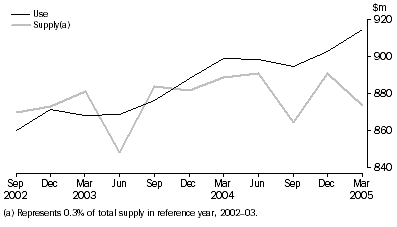 Water supply, sewerage & drainage services
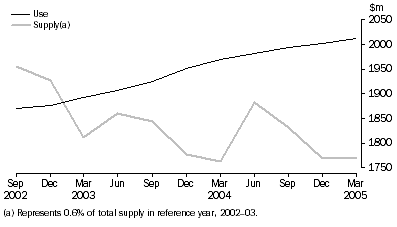 Construction
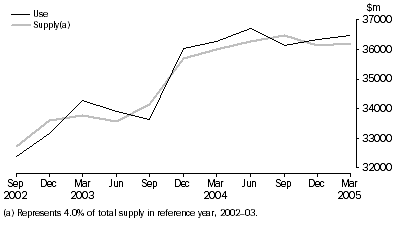 Other retail & wholesale services
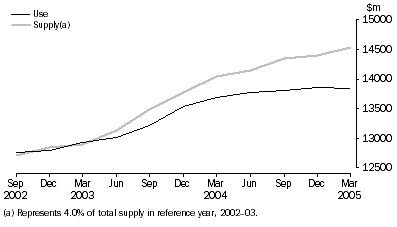 Accommodation, cafes & restaurants
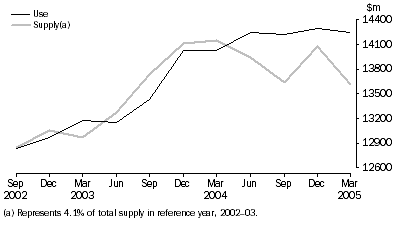 Road transport
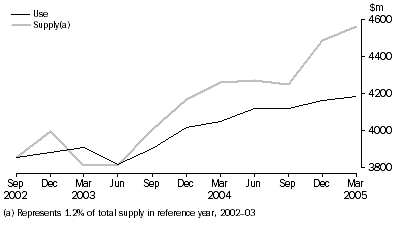 Air & space transport
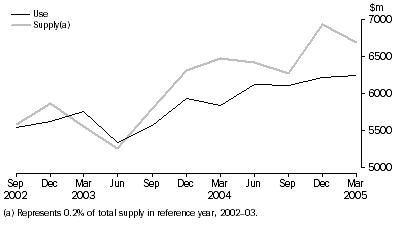 Water transport
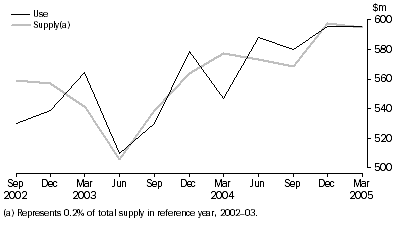 Rail, pipeline & other transport
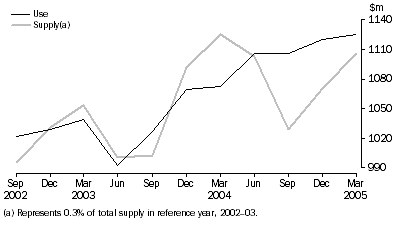 Transport services & storage
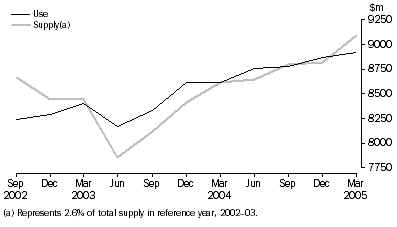 Communication services
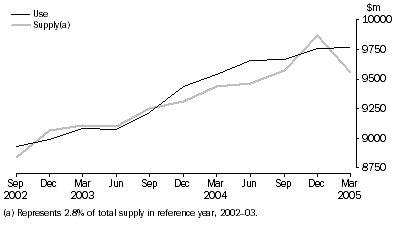 Financial & insurance services
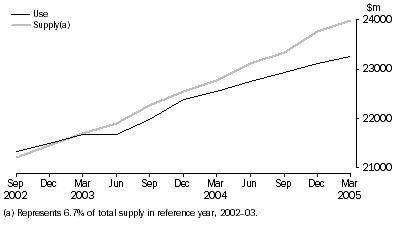 Property & business services
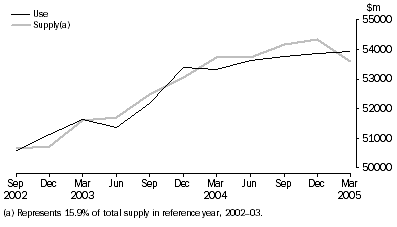 Government administration & defence
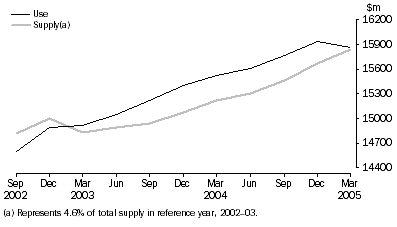 Education
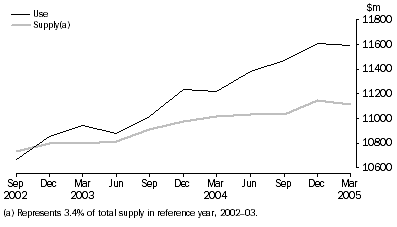 Health & community services
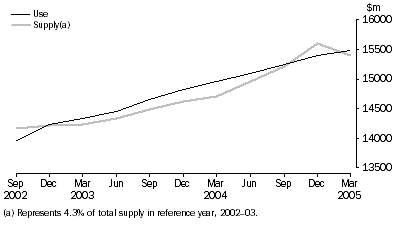 Cultural & recreational services
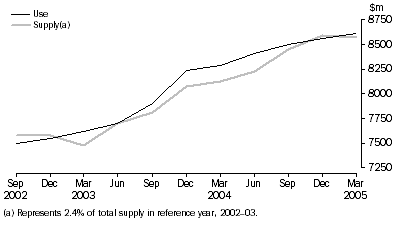 Personal & other services
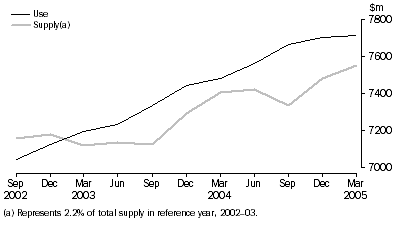 Ownership of dwellings
 Print Page
 Print All