TOTAL ENVIRONMENTAL TAX REVENUES
In 2010-11, Australia's environmental taxes amounted to $26 billion and accounted for 2% of GDP and 7% of total tax revenues. This proportion of the GDP has decreased in the past 10 years (see Table 6.1). The largest contributor to tax revenue from environmental taxes is the excise duty on crude oil and LPG, accounting for 65% of total environmental taxes in 2010-11.
It should be noted that the "Petroleum products taxes" ceased in 2001-02 while new petroleum taxes were introduced the same year. These taxes are included in "Crude oil, LPG and petroleum products".
6.1 Environmental taxation revenue, Australia, 2000-01 to 2010-11, $m, current prices |
|
 | 2000-01 | 2005-06 | 2010-11 |
|
| Crude oil, LPG, gas and petroleum products | 12 453 | 14 075 | 16 305 |
| Petroleum products taxes | 174 | - | - |
| Ozone Protection and synthetic GHG(a) | 1 | 1 | 1 |
| Renewable energy certificates(b) | - | 90 | 980 |
| Stamp duty on vehicle registration | 1 387 | 1 922 | 2 167 |
| Road maintenance and heavy vehicle registration(c) | 2 646 | 3 672 | 5 294 |
| Luxury car tax(d) | 172 | 324 | 489 |
| Passenger motor vehicles duty (import)(a) | na | na | 780 |
| Total environmental taxes | 16 833 | 20 085 | 26 016 |
| % of GDP(e) | 2 | 2 | 2 |
| % of total tax rev(e) | 8 | 7 | 7 |
|
| - nil or rounded to zero (including null cells) |
| na not available |
| (a) Department of Sustainability, Environment, Water, Population and Communities. |
| (b) Derived, sourcing data from Clean Energy Regulators and NextGen, data extracted July 2012. |
| (c) Also includes transfer fees, motor vehicle weight/Engine capacity tax and road user charges. |
| (d) Government budget 2011. |
| (e) Not including Renewable energy certificates as the aggregates GDP and total tax revenues does not include them. |
| Source: ABS cat. no. 5506.0 Taxation revenue 2010-11 |
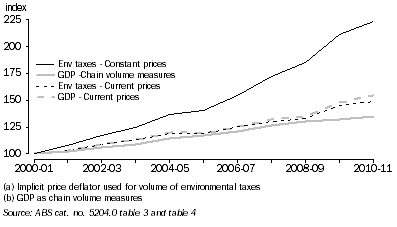
The fall in environmental taxes as a percentage of GDP is driven by a greater increase in GDP in current prices. As noted in Table 6.1, environmental taxes have increased close to 55 per cent over the stated time period. However, in terms of constant prices, environmental taxes have grown more than GDP over the stated period (as seen in Figure 6.2)
(footnote 1) .
6.2 Volume measures of environmental taxes(a) and GDP(b) - Index 2000-01=100

As the carbon price mechanism will be included in future statistics on environmental taxes that will change the level of revenues raised in the area. It is expected that the revenues will have an impact on the growth of the tax share of GDP.
1 Taxes are normally not calculated as constant prices as taxes do not have a price but their products do. The composition of the implicit price deflator does therefore not reflect a true relationship to the taxes in question. The implicit price deflator used in this case is a means to evaluate the movement in conjunction with GDP in volumes.
<back
 Print Page
 Print All