PRISONERS
The annual National Prisoner Census, conducted on the night of 30 June, counts all people who are in the legal custody of adult corrective services in adult prisons, including periodic detainees in New South Wales and the Australian Capital Territory, but excluding persons held in juvenile institutions, psychiatric custody and police custody. At any given point in time, most prisoners are serving long sentences for relatively serious offences, but the flow of offenders in and out of prisons consists primarily of people serving short sentences for less serious offences.
At 30 June 2006, there were 25,790 prisoners (sentenced and unsentenced) in Australian prisons. This represented an imprisonment rate of 163 prisoners per 100,000 adult population. Of the total prisoner population, 93% (23,963) were men and 7% (1,827) were women (table 13.26).
Unsentenced prisoners include prisoners awaiting a court hearing or trial and convicted prisoners awaiting sentencing. Unsentenced prisoners comprised 22% (5,581) of the total prisoner population.
Most (57% or 14,676) prisoners (both sentenced and unsentenced) had served time in an adult prison prior to the current episode.
Acts intended to cause injury was the most serious offence/charge which accounted for the largest proportion of prisoners (18% or 4,630 prisoners).
13.26 PRISONERS(a), Selected characteristics by most serious offence/charge - 30 June 2006 |
|  |
| | | Homicide and related offences | Acts intended to cause injury | Sexual assault and related offences | Robbery, extortion and related offences | Unlawful entry with intent | Illicit drug offences | Other offences(b) | Total | |
| |
| All prisoners | no. | 2 584 | 4 630 | 2 939 | 2 598 | 3 095 | 2 516 | 7 428 | 25 790 | |
| Males | no. | 2 389 | 4 327 | 2 913 | 2 469 | 2 909 | 2 267 | 6 689 | 23 963 | |
| Females | no. | 195 | 303 | 26 | 129 | 186 | 249 | 739 | 1 827 | |
| Indigenous | no. | 396 | 1 937 | 597 | 534 | 835 | 84 | 1 708 | 6 091 | |
| Non-Indigenous | no. | 2 164 | 2 645 | 2 331 | 2 032 | 2 247 | 2 398 | 5 653 | 19 470 | |
| Unknown | no. | 24 | 48 | 11 | 32 | 13 | 34 | 67 | 229 | |
| Median age | | | | | | | | | | |
| Males | years | 37 | 31 | 42 | 29 | 30 | 37 | 32 | 33 | |
| Females | years | 37 | 31 | 43 | 28 | 30 | 37 | 34 | 33 | |
| Indigenous | years | 36 | 30 | 35 | 27 | 27 | 35 | 31 | 31 | |
| Non-Indigenous | years | 38 | 31 | 45 | 30 | 30 | 37 | 33 | 34 | |
| Sentenced | no. | 2 067 | 3 016 | 2 514 | 2 044 | 2 424 | 2 056 | 6 088 | 20 209 | |
| Unsentenced | no. | 517 | 1 614 | 425 | 554 | 671 | 460 | 1 340 | 5 581 | |
| Prior imprisonment(c) | no. | 1 080 | 2 848 | 1 138 | 1 643 | 2 291 | 904 | 4 772 | 14 676 | |
| No prior imprisonment(c) | no. | 1 504 | 1 781 | 1 798 | 955 | 803 | 1 611 | 2 654 | 11 106 | |
| Unknown(c) | no. | - | 1 | 3 | - | 1 | 1 | 2 | 8 | |
| |
| - nil or rounded to zero (including null cells) |
| (a) The data presented in this table have been confidentialised to prevent identification of individuals. |
| (b) Includes Australian Standard Offence Classification Divisions 04, 05, 08, 09 and 11 to 16. |
| (c) Refers to prior adult imprisonment under sentence. |
| Source: Prisoners in Australia (4517.0). |
The median age of for both men and women prisoners was 33 years.
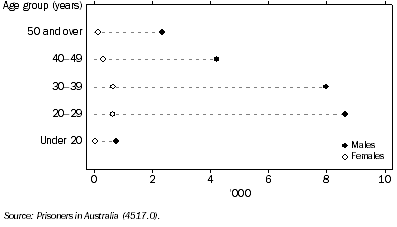
The majority of prisoners (16,645 or 70% of men and 1,304 or 72% of women) were aged 20-39 years (graph 13.27).
13.27 Prisoners - 30 June 2006
There were 6,091 Indigenous prisoners at 30 June 2006, comprising 24% of the total prisoner population. The age-standardised Indigenous imprisonment rate was 1,668 per 100,000 adult Indigenous population, 13 times more than the non-Indigenous rate (130 per 100,000 adult non-Indigenous population).
 Print Page