Featured article: Household Wealth Through the Lifecycle
Following is the first in a series of articles on topical aspects of ageing that will be featured in this newsletter . Typically, these articles will be a condensed form of more detailed studies which are available on request. This article reflects recent work undertaken by the ABS Analytical Services Branch.
Household Wealth Through the Lifecycle
The ABS has recently published experimental estimates of the distribution of household wealth for the years 1994 to 2000. The distribution of wealth across age groups is a particular feature of this analysis. These experimental estimates are based on models applied to range of data sources rather than having been estimated from, for example, a single household survey.
Overall changes in household assets and liabilities
Overall net worth (that is, total assets less total liabilities) of the household sector grew by just over 45% in the seven-year period of the study. These estimates are expressed in current prices - that is, they are not adjusted to remove the effects of price changes.
Dwellings were the most significant asset, representing 46% of the total at 30 June 2000. Superannuation has also increased significantly - it accounted for 21% of total assets in 2000, up from 16% in 1994. In 1994, ownership of shares made up 6% of total assets, whereas in 2000 they accounted for 8%. Currency and deposits were significant assets throughout the seven year period, and accounted for 9% of the total in 2000.
Liabilities grew significantly over the period from 1994 to 2000. In 1994, the liabilities of households were equivalent to a little under 13% of the value of total assets; by 2002, liabilities were equivalent to around 18%.
Distribution of wealth across age groups
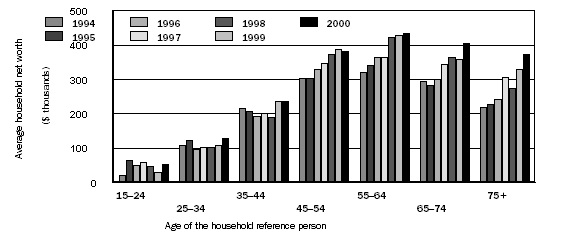
Graph 1 shows how net worth varied according to the age of the household reference person. (The reference person is selected from the adults in the household’s primary family, using data on relationships, gender, income and age.) The data suggest a pattern of lifetime wealth accumulation; later analyses will explore whether this pattern is due to genuine lifecycle effects, to the effects of the particular years of study or of birth-year cohorts. Net worth appears to build until retirement, then is slowly reduced as households draw down on their assets in later years. Average net worth has fluctuated from year to year for households where the reference person’s age was less than 45, but may have been slowly increasing over time. The average net worth of middle-aged and older households has clearly risen between 1994 and 2000.
Some fluctuations in the estimates from year to year are to be expected, as they are based on sample survey data, and the data and methods used to generate the estimates have varied. Thus one should concentrate on the main trends in the data, rather than on year-to-year movements.
Graph 1: Average household net worth by the age of the household reference person, as at 30 June

Distribution of particular assets across age groups
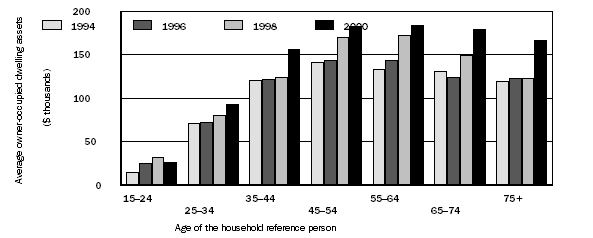
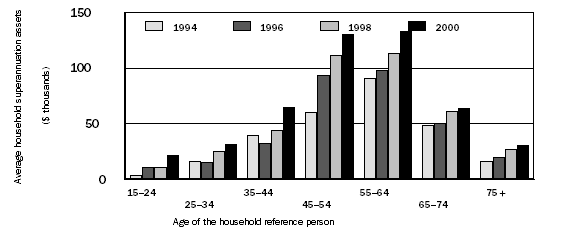
Dwelling and superannuation assets make up the largest percentage of household sector wealth, and their movements explain a good deal of the movement in net worth. Rising average dwelling values were a significant factor in the increase in net worth for middle-aged and older households. See graph 2.
Graph 2 : Average owner-occupied dwelling assets by the age of the household reference person, as at 30 June
Average superannuation assets rose significantly between 1994 and 2000 for middle-aged and older households. See graph 3.
Graph 3: Average household superannuation assets by the age of the household reference person, as at 30 June
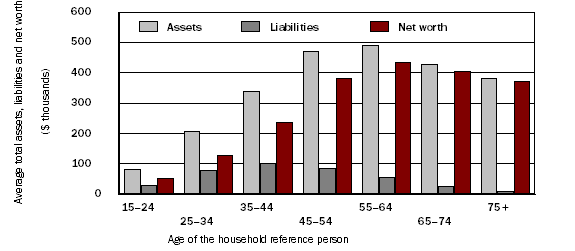
The value of net worth also depends on the liabilities which a household has accrued. Graph 4 illustrates how average total assets, liabilities and net worth were distributed across reference person age groups, in 2000. Assets and net worth are distributed in very similar ways, while liabilities peak in younger and middle age groups, before households have paid out major loans such as those for their home and/or car. Similar patterns were observed in each of the years studied.
Graph 4: Average household assets, liabilities (absolute value) and net worth by the age of the household reference person, as at 30 June 2000

Possible future work
In contrast to many statistics published by the ABS, these experimental estimates have been based on models applied to a wide range of census, survey and administrative by product data. The ABS is keen to receive comments from users on the methods and findings. During 2003, the ABS will assess the experimental estimates in the light of feedback received, and will decide what further modelling and analysis work would be fruitful.
For more information: see Experimental Estimates of the Distribution of Household Wealth, Australia, 1994-2000 by Kristen Northwood, Terry Rawnsley and Lujuan Chen (Working Papers in Econometrics and Applied Statistics, No. 2002/1, ABS Catalogue No. 1351.0).
 Print Page
 Print All