|
|
Contents >>
Education >>
Participation in Education: Gender differences in higher education
Participation in Education: Gender differences in higher education
More women than men participate in higher education. While women are increasingly more likely to choose fields of study in which they have been under- represented, men continue to make traditional choices.
Gender equality in education is concerned with a desire to attain full human potential and to harness productive resources more effectively. Whether in access to and participation in higher education or in the choice of fields of study, the aim is to expand the range of possibilities open to both men and women. The evidence of recent years is that action in this area has impacted more on women than it has on men
In the past there have been strongly differentiated paths for men and women in education, both in field of study and in level of attainment. Historically, university education was limited to only those men who could afford it. However, since the first woman graduated in 1883, women's participation in higher education has steadily increased. The gap between the proportions of women and men with degrees has been closing in recent years. In 1993, 9% of women and 11% of men aged 15-69 years had a degree compared to 5% of women and 9% of men in 19841.
Since 1989 there have been more women than men aged 15-24 years participating in higher education. Although this is partially due to nursing courses gaining university status, there is evidence that women are continuing to increase in their participation in higher education as well as an increasing their proportion of higher education enrolments who are female.
In the Australian higher education sector, the creation of the Unified National System in 1988 led to a gradual phase-out of colleges of advanced education, institutes of technology, agricultural colleges and other institutions of a similar nature. Campuses were amalgamated and given the same recognition and funding arrangements as universities. The total number of higher education places available also increased. These moves are part of the transformation to mass higher education.
Another aspect of the transformation is concerned with equity of access to higher education for all groups in the community. In 1990 the Government developed the policy A fair chance for all: higher education that's within everyone's reach2. It defined objectives and set out national strategies '...to ensure that Australians from all groups in society have the opportunity to participate successfully in higher education. This will be achieved by changing the balance of the student population to reflect more closely the composition of society as a whole.' The report recognised the major changes that had occurred in higher education participation for women in the last decade but was still concerned with their representation within particular courses and at higher levels.
In the report a number of the objectives set were concerned with redressing the balance between men and women in higher education. Three main targets were identified: an increase in the proportion of women in non-traditional courses, other than engineering, from the current level to at least 40% by 1995; an increase in the proportion of women in engineering courses from 7% to 15% by 1995; and an increase in the number of women in post-graduate study, particularly in research, relative to the proportion of female undergraduates in each field by 1995. Strategies for achieving these targets included bridging courses, supplementary support (including careers counselling, mentor schemes, setting up networks etc.), curriculum reviews, child care, and flexibility of course arrangements. In addition, non-traditional courses and post-graduate research were to be encouraged and promoted through schools, media, community groups, professional associations and government agencies.
Between 1988 and 1992 the proportions of women enrolled in non-traditional courses increased. However, the proportion of women in every course increased, including those fields where men are not well represented such as arts, education and health. This suggests that, although there has been some movement of women into non-traditional courses, male students have continued to make conventional choices.
PROPORTION OF PERSONS AGED 15-24 YEARS IN HIGHER EDUCATION
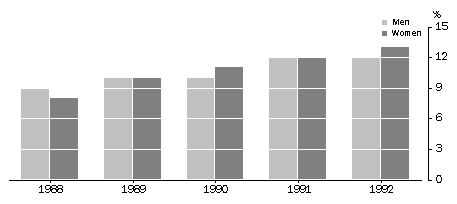
Source: Survey of Participation in Education
Standardisation
Comparisons over time of the proportions of students who are female in a particular field of study or level of course are affected by the increase in the overall proportion of students in higher education who are female. This effect can be discounted by standardisation. The technique holds the proportion of students who are female constant (at the 1988 value) and applies the distribution of students by field of study or level of course for any particular year. Comparisons of the resulting proportions female show the changes in representation due to changes in course participation alone. |
Field of study
In 1992 traditional choices still dominated for both men and women in higher education. 29% of female higher education students were enrolled in courses in arts, humanities and the social sciences, compared to 16% of male students. Correspondingly, 26% of male students were in business, administration and economics compared to 17% of female students. 15% of male students studied engineering or surveying compared to 2% of female students and 8% of male students studied education compared to 19% of female students.
When standardised to the proportion of female students in 1988, the data indicate that courses which have been traditionally dominated by men are gradually moving towards equal participation. In particular, the engineering/surveying field, which had 8% female participation in 1988, had increased to 11% (standardised) by 1992.
However, expanding the range of options and possibilities open to people is achieved as much by men moving into areas that were traditionally dominated by women, as it is by encouraging women into male dominated areas. Participation in those fields which women have traditionally studied, such as education, health, arts, humanities and social sciences, has not moved substantially towards equality. Rather it has remained much the same, or in the case of health, the standardised proportion of students who were female has increased3. Thus in recent years, it is largely women who have shifted not men. Achievement of greater gender equality in higher education in the future will therefore be constrained by the lack of change in male course preferences.
HIGHER EDUCATION STUDENTS BY FIELD OF STUDY(a), 1992
|
 | Men | Women | Persons | Proportion female |
| Field of study | % | % | % | % |
|
| Agriculture, animal husbandry | 2.7 | 1.2 | 1.9 | 34.1 |
| Architecture, building | 3.0 | 1.4 | 2.1 | 34.3 |
| Arts, humanities and social sciences | 15.6 | 28.7 | 22.6 | 67.9 |
| Business, administration, economics | 26.1 | 16.9 | 21.1 | 42.6 |
| Education | 8.3 | 19.2 | 14.1 | 72.7 |
| Engineering, surveying | 14.9 | 1.7 | 7.9 | 11.8 |
| Health | 6.6 | 16.9 | 12.1 | 74.5 |
| Law, legal studies | 3.7 | 2.8 | 3.3 | 46.5 |
| Science | 18.8 | 10.9 | 14.6 | 40.0 |
| Veterinary science | 0.3 | 0.3 | 0.3 | 54.0 |
 |
| Total | 100.0 | 100.0 | 100.0 | 53.0 |
 |  |  |  |  |
 | '000 | '000 | '000 |  |
| Total | 257.1 | 296.0 | 553.8 | . . |
|
(a) Excludes non-award courses.
Source: Department of Employment, Education and Training Selected Higher Education Statistics
PROPORTION OF HIGHER EDUCATION STUDENTS WHO ARE FEMALE BY FIELD OF STUDY(a) (STANDARDISED TO 1988)
|
 | 1988 | 1989 | 1990 | 1991 | 1992 |
| Field of study | % | % | % | % | % |
|
| Agriculture, animal husbandry | 31.0 | 31.1 | 31.5 | 30.7 | 32.0 |
| Architecture, building | 30.7 | 31.3 | 31.9 | 31.7 | 32.2 |
| Arts, humanities and social sciences | 66.8 | 66.8 | 66.5 | 65.8 | 65.7 |
| Business, administration, economics | 36.6 | 38.0 | 39.0 | 39.6 | 40.2 |
| Education | 70.4 | 71.1 | 71.0 | 70.8 | 70.7 |
| Engineering, surveying | 7.8 | 8.6 | 9.5 | 10.0 | 10.8 |
| Health | 68.7 | 69.8 | 70.8 | 72.1 | 72.6 |
| Law, legal studies | 41.7 | 42.6 | 43.5 | 44.0 | 44.1 |
| Science | 36.5 | 36.8 | 37.2 | 37.3 | 37.6 |
| Veterinary science | 49.3 | 50.1 | 50.8 | 50.5 | 51.5 |
 |
| Total | 51.0 | 51.0 | 51.0 | 51.0 | 51.0 |
|
(a) Excludes non-award courses.
Source: Department of Employment, Education and Training Selected Higher Education Statistics
Level of course
Government policy has also focused on the uneven sex balance in the upper levels of higher education participation. The lower proportions of women studying at post-graduate level have at least two implications for policy makers: the impact on women's employment opportunities and realisable income levels; and the impingement on women's participation in undergraduate courses due to fewer role models and female mentors.
The participation of women in higher education generally decreases as course levels increase. In 1992, while 55% of undergraduate students were women, this proportion reduced to 42% for higher degree students. There appear to be two major obstacles to achieving greater equality in the proportions of men and women studying at higher levels: the lack of proportional equality at lower levels in non-traditional fields of study for each sex; and the strong vocational nature of many courses traditionally undertaken by women for which a higher degree is not necessarily the most useful career move.
Since 1988 participation in higher degrees has increased for both sexes. However, the greatest change in the proportion of students who are female has been in other award courses (diploma or associate diploma level), largely as a result of the upgrading of nursing courses from diplomas to degrees. The standardised proportion of women enrolled in other award courses has dropped significantly, from 67% in 1989 to 58% in 1992. The standardised proportions of women enrolled at all other levels have increased since 1988, with the largest increase (3 percentage points) in the proportion of women studying for higher degrees by research.
Across the fields of study, participation in higher degrees follows the traditional patterns. Of all students in each of the fields of arts, health and education, more women than men were undertaking higher degrees. However, in comparison to the sex distribution at undergraduate level, men were more likely than women to proceed to post-graduate study.
PROPORTION OF HIGHER EDUCATION STUDENTS WHO ARE FEMALE BY LEVEL OF COURSE, 1992
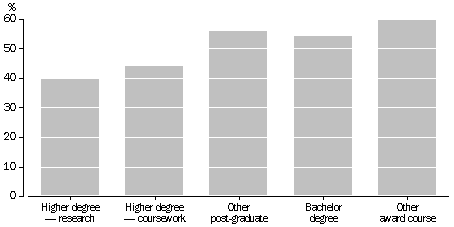
Source: Department of Education, Employment and Training, Selected Higher Education Statistics.
PROPORTION OF HIGHER EDUCATION STUDENTS WHO ARE FEMALE BY LEVEL OF COURSE(a) (STANDARDISED TO 1988)
|
| Level of course | 1988 | 1989 | 1990 | 1991 | 1992 |
 | % | % | % | % | % |
|
| Higher degree - research | 34.1 | 34.8 | 35.3 | 35.9 | 37.3 |
| Higher degree - coursework | 39.9 | 39.1 | 40.0 | 41.3 | 41.8 |
| Other post-graduate | 52.3 | 54.2 | 53.6 | 53.9 | 53.5 |
| Bachelor degree | 49.0 | 48.8 | 49.4 | 50.0 | 51.5 |
| Other award course | 65.7 | 66.9 | 65.6 | 64.9 | 58.0 |
 |
| Total | 51.0 | 51.0 | 51.0 | 51.0 | 51.0 |
|
(a) Excludes non-award courses.
Source: Department of Employment, Education and Training Selected Higher Education Statistics
HIGHER EDUCATION STUDENTS BY LEVEL OF COURSE AND FIELD OF STUDY(a), 1992
|
 |  | Women |  | Men |  |  |
 |
|
|  |  |
 | Post-graduate | Under-graduate | Post-graduate | Under-graduate | All persons in higher education |
| Field of study | % | % | % | % | % | '000 |
|
| Agriculture, animal husbandry | 4.5 | 29.7 | 10.6 | 55.2 | 100.0 | 10.5 |
| Architecture, building | 5.8 | 28.6 | 13.3 | 52.3 | 100.0 | 11.9 |
| Arts, humanities and social sciences | 9.6 | 58.3 | 5.7 | 26.4 | 100.0 | 125.0 |
| Business, administration, economics | 5.6 | 37.0 | 11.4 | 45.9 | 100.0 | 117.1 |
| Education | 22.0 | 50.7 | 10.7 | 16.6 | 100.0 | 78.1 |
| Engineering, surveying | 1.7 | 10.1 | 14.4 | 73.8 | 100.0 | 43.6 |
| Health | 9.9 | 64.6 | 5.0 | 20.5 | 100.0 | 67.2 |
| Law, legal studies | 8.5 | 38.0 | 11.8 | 41.6 | 100.0 | 18.0 |
| Science | 5.7 | 34.3 | 11.7 | 48.3 | 100.0 | 80.7 |
| Veterinary science | 7.0 | 47.0 | 11.7 | 34.3 | 100.0 | 1.7 |
 |
| Total | 9.1 | 44.3 | 9.6 | 37.0 | 100.0 | 553.8 |
|
(a) Excludes non-award courses.
Source: Department of Employment,Education and training Selected Higher Education Statistics
Endnotes
1 Survey of Labour Force Status and Educational Attainment.
2 Department of Employment, Education and Training, NBEET (1990) A fair chance for all: higher education that's within everyone's reach.
3 The interpretation of trends in the male/female distribution of students enrolled in health courses is complicated by the diverse nature of courses under the general heading of health studies (e.g. medicine, dentistry, physiotherapy, nursing etc.) which are likely to exhibit quite different male/female participation rates.
|
 Print Page
 Print All