KEY FINDINGS
HOUSEHOLDS WITH INTERNET ACCESS AT HOME
Use of the internet allows access to a wide range of information, goods and services and is a key means of communication with other individuals, communities, businesses and governments.
Internet access over time
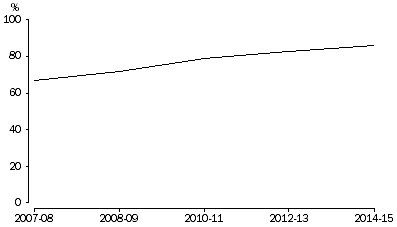
The number of households with access to the internet at home increased, reaching 7.7 million in 2014–15, representing 86% of all households (up from 83% in 2012–13).
Households with internet access at home, 2007–08 to 2014–15

Household characteristics
In 2014–15 for those households with children aged under 15 years, 97% had access to the internet compared with 82% of households without children under 15.
Households located in major cities were more likely to have internet access at home (88%) than those in remote or very remote parts of Australia (79%).
Devices used to access the Internet at home
A range of devices may be used to access the internet and in 2014–15 information on the types of devices used by households to access the internet at home was collected for the first time. Most households who accessed the internet did so through a desktop or laptop computer (94%), followed by households who accessed via mobile or smart phones (86%) and households who accessed via tablets (62%). Households may have used one or more of these types of devices.
The mean number of devices used to access the internet at home by all households was 6. For households with children aged under 15 years the mean number of devices used to access the internet at home was 7.
Households without Internet access at home
There were 1.3 million Australian households without internet access at home in 2014–15 (14%). In 2014–15, information about the main reasons for a household not having internet access was collected for the first time since 2005-06. The main reasons given for not accessing the internet at home were: no need (63%), lack of confidence or knowledge (22%), and cost (16%). The main reason given for not accessing the internet differed according to whether or not children aged under 15 years were present in the household. For households with children under 15 years, the most common reason given for not accessing the internet was cost (43%). For households without children under 15 years, the main reason given for not accessing the internet was having no need for access (64%). Having no need for access to the internet at home was also the main reason given by both households in major cities (61%) and households in remote or very remote Australia (50%).
PERSONS USE OF THE INTERNET
Persons characteristics
In 2014–15, 85% of people were internet users (persons aged 15 years and over who accessed the internet for personal use in a typical week). Those people in the 15–17 years age group had the highest proportion of internet users (99%) compared with the older age group (65 years and over) which had the lowest proportion of internet users (51%). The proportions of males and females accessing the internet were almost the same, at 84% and 85% respectively.
In 2014–15, 96% of those with a bachelor degree or above were internet users. Of those educated to year 12 or below, 77% were internet users.
Of those employed, 93% were internet users compared with 70% of those not employed. For those in the highest equivalised household income quintile 97% were internet users compared with 67% of those in the lowest income quintile.
Hours spent online
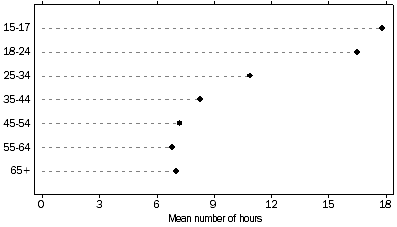
In 2014–15 information was collected for the first time on the number of hours spent online for personal use in a typical week. For all internet users, the mean number of hours per week spent on the internet for personal use was 10. Those aged 15–17 years spent the highest mean number of hours per week on the internet (18 hours per week) and those in the 45–54 years, 55–64 years and 65 years or over age groups spent the lowest mean number of hours (7 hours per week). The mean number of hours spent per week on the internet by both males and females was 10 hours.
Internet users, mean number of hours by age group, 2014–15

Reasons for accessing the internet
Internet users were asked to report their participation in selected internet activities in the last 3 months. In 2014–15, the four most popular online activities were: banking (72%); social networking (72%); purchasing goods or services (61%); and entertainment (60%).
Overall, internet use was highest among the younger age groups (persons under the age of 35). Those aged 15–17 years old most commonly went online for social networking (91%), followed by entertainment and formal education activities (73% for both). For those aged 65 years and over the most common activities online were the same as for all internet users: banking (50%); and social networking (43%).
Purchasers of goods or services online
In 2014–15 the proportion of internet users who purchased or ordered goods or services over the internet in the last 3 months was 61% (representing 9.7 million people). The three most common groups of goods or services purchased or ordered online by internet users were: music, movies, electronic games or books (50%); clothes, cosmetics or jewellery (46%); and tickets and bookings for entertainment events (45%).
For those aged 15–17 years the most common group of goods or services purchased or ordered online was music, movies, electronic games or books (60%), followed by clothes, cosmetics or jewellery (56%). For those aged 65 years and over the most common groups of goods or services purchased or ordered online were travel tickets, accommodation and related services (40%), followed by music, movies, electronic games or books (35%). For males the most common group of goods or services purchased or ordered online was music, movies, electronic games or books (50%), while for females it was clothes, cosmetics or jewellery (58%).
Transactions
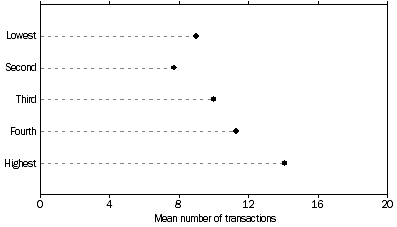
As well as the types of goods or services purchased or ordered over the internet there is interest in the quantity of transactions and this information was collected for the first time in 2014–15. Overall, the mean number of transactions for internet users who purchased or ordered goods or services online in the last 3 months was 11 transactions. The mean number of transactions was lowest for those in the lowest and second equivalised household income quintiles (9 and 8 transactions respectively) and highest for those in the highest equivalised household income quintile (14).
Internet users who purchased or ordered goods or services online, mean number of transactions made by household income quintile, 2014–15

Internet users in major capital cities who purchased or ordered goods or services online had a lower number of mean transactions (11) than those who lived in remote or very remote areas (13).
Employed persons
Home-based work and internet access
Of the 11.7 million employed people aged 15 years and over, 44% accessed the internet for home based work in the last 3 months. Types of home based work comprised home based work for an employer on an occasional basis (17% of employed persons), home based work for an employer on a regular basis (16% of employed persons) and home based work for own business (16% of employed persons).
Characteristics of home-based workers
There was a slightly higher proportion of employed males (46%) than employed females (42%) who accessed the internet for home based work in the last 3 months. Of all employed people, those in the highest equivalised household income quintile had the highest proportion of people who accessed the internet for home based work (62%), compared with 32% in the lowest equivalised household quintile and 29% in the second equivalised household quintile. In major cities and remote or very remote Australia the proportions of employed people who accessed the internet for home based work were the same (46%). In inner regional and outer regional Australia these proportions were 38% and 35% respectively.
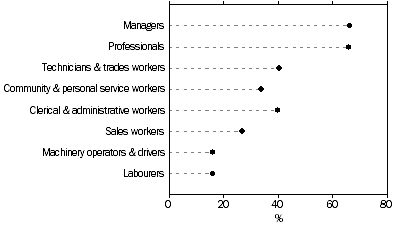
Persons employed in a range of occupations accessed the internet for home based work. Managers (66%) and professionals (66%) had the highest proportions of any occupation group who accessed the internet for home based work. Machinery operators and drivers (16%) and labourers (16%) had the lowest proportions of home based workers who accessed the internet for home based work.
Employed persons who accessed the internet for home based work, by occupation, 2014–15

 Print Page
 Print All
 Quality Declaration